Ichimoku Cloud Basics for Gold Prices
Ichimoku Cloud Basics for Gold Prices
The Ichimoku Cloud is a powerful tool for analyzing gold price trends. It combines multiple components into a single indicator, helping traders identify trends, key price levels, and potential buy or sell signals. Here's what you need to know:
- Key Components: Includes Conversion Line (short-term), Base Line (medium-term), Cloud Formation (support/resistance), and Lagging Line (trend confirmation).
- Cloud Colors: Orange clouds signal bullish momentum, while purple clouds indicate bearish trends.
- Price Position: Gold above the cloud suggests an uptrend, below the cloud indicates a downtrend, and within the cloud signals consolidation.
- Strong Signals: Look for price breaking above the cloud, Tenkan-sen crossing Kijun-sen, and Lagging Line confirming the trend.
- Data Accuracy: Tools like OilpriceAPI provide real-time and historical data to enhance analysis.
This method works across different market conditions and helps traders make informed decisions by combining visual clarity with actionable insights.
Ichimoku Cloud Strategy on Gold: Simple Trade Setup
5 Main Parts of the Ichimoku Cloud
The Ichimoku Cloud indicator has five key components that work together to analyze gold price movements. Understanding each part helps traders interpret trends and make better decisions in the gold market.
Conversion and Base Lines
The Tenkan-sen (9-period average) and Kijun-sen (26-period average) highlight short- and medium-term trends. These lines help traders spot momentum shifts and identify potential support or resistance levels [3].
| Line Type | Calculation Period | Purpose |
|---|---|---|
| Tenkan-sen | 9 periods | Tracks short-term momentum |
| Kijun-sen | 26 periods | Identifies medium-term levels |
The Cloud Formation
The cloud, created by Senkou Span A and Senkou Span B, outlines critical support and resistance levels [4]. This is especially useful for gold traders dealing with unpredictable markets.
- A thicker cloud suggests stronger support or resistance.
- If gold prices are above the cloud, it indicates an upward trend.
- If prices are below the cloud, it points to a possible downward trend.
The Lagging Line
The Chikou Span plots the closing price 26 periods behind the current price. This helps confirm trends and reversals in gold prices [3]. When paired with the cloud, it provides extra confirmation for long-term trading decisions.
Reading Gold Price Signals
What Cloud Colors Mean
The Ichimoku Cloud provides a visual snapshot of market sentiment. An orange cloud reflects bullish momentum (Senkou Span A above Span B), while a purple cloud points to bearish pressure (Senkou Span A below Span B) [3][4].
Thicker clouds indicate stronger market conviction and more reliable support or resistance levels. When studying gold prices, pay close attention to transitions from thin to thick clouds - these often highlight key pivot points [5][3]. Beyond the colors, the position of gold prices relative to the cloud offers additional insight into market trends.
Price Location vs Cloud
Gold’s position in relation to the cloud acts as a core trend indicator:
| Price Position | Market Signal | Trading Implication |
|---|---|---|
| Above Cloud | Bullish Trend | Look for buying opportunities |
| Below Cloud | Bearish Trend | Consider short positions |
| Inside Cloud | Consolidation | Wait for a breakout |
When prices are inside the cloud, it signals uncertainty. Traders typically wait for a clear breakout - either above or below - before making new moves [1][3].
Key Signal Points
Strong trading signals come from how the Ichimoku components interact. A robust buy signal occurs when:
- Gold price breaks above the cloud
- Tenkan-sen crosses above Kijun-sen
- Chikou Span (Lagging Line) moves above the price from 26 periods ago [1][5]
The Lagging Line serves as trend confirmation. If it’s above the price from 26 periods ago, it supports a buy signal; if below, it confirms a sell signal [3].
"The Lagging Line provides additional confirmation of buy and sell signals. If the Lagging Line is above the price 26 periods ago, it confirms a buy signal. Conversely, if it is below the price 26 periods ago, it confirms a sell signal" [3].
When the Tenkan-sen (Conversion Line) crosses above the Kijun-sen (Base Line) while prices are already above the cloud, it strengthens the bullish signal [3].
Relying on a single indicator can be risky. Combine Ichimoku signals with other technical tools and use real-time data services, such as OilpriceAPI, to ensure your trading decisions are backed by up-to-date market information [1][3].
sbb-itb-a92d0a3
Trading Gold with Ichimoku Cloud
Understanding Market Trends
The Ichimoku Cloud is a helpful tool for analyzing gold's market trends. It works by comparing the price to the cloud and assessing the cloud's thickness. A thicker cloud suggests stronger support or resistance, making it useful for analyzing long-term trends. If gold prices are above the cloud, it typically signals an uptrend. On the other hand, prices below the cloud often point to a bearish trend [1].
Key Price Levels
The Ichimoku Cloud identifies dynamic support and resistance zones that adjust with market changes. Here are the main components to watch:
| Cloud Component | Trading Role | Key Action |
|---|---|---|
| Cloud Top | Acts as resistance | Possible reversal point in uptrends |
| Cloud Bottom | Serves as support | Likely bounce area in downtrends |
| Tenkan-sen | Short-term indicator | Immediate support or resistance |
| Kijun-sen | Medium-term indicator | Confirms major trends |
These levels become especially important during strong trends. When multiple components align near the same price, they create stronger zones of support or resistance [1][3]. Traders can use these levels to plan entry and exit points more effectively.
Timing Your Trades
Good trade timing requires patience and confirmation of signals. For bullish trades, wait until gold prices move above the cloud and the Tenkan-sen crosses the Kijun-sen, signaling upward momentum [1][3].
Watch for potential reversals in these situations:
- Prices fall below the cloud after a prolonged uptrend.
- The Tenkan-sen crosses below the Kijun-sen near cloud resistance.
- Other technical indicators show divergence from the price movement [1][3].
To improve accuracy, combine Ichimoku analysis with real-time gold price data. Services like OilpriceAPI can help confirm signals and ensure decisions are based on up-to-date market information.
Data Tools for Analysis
Precise data is crucial for effective Ichimoku Cloud analysis. OilpriceAPI provides up-to-date and historical gold price data through its API, making it a reliable resource for calculating Ichimoku Cloud components. It offers multiple timeframes, backtesting options, and integrates smoothly with trading platforms.
OilpriceAPI Overview
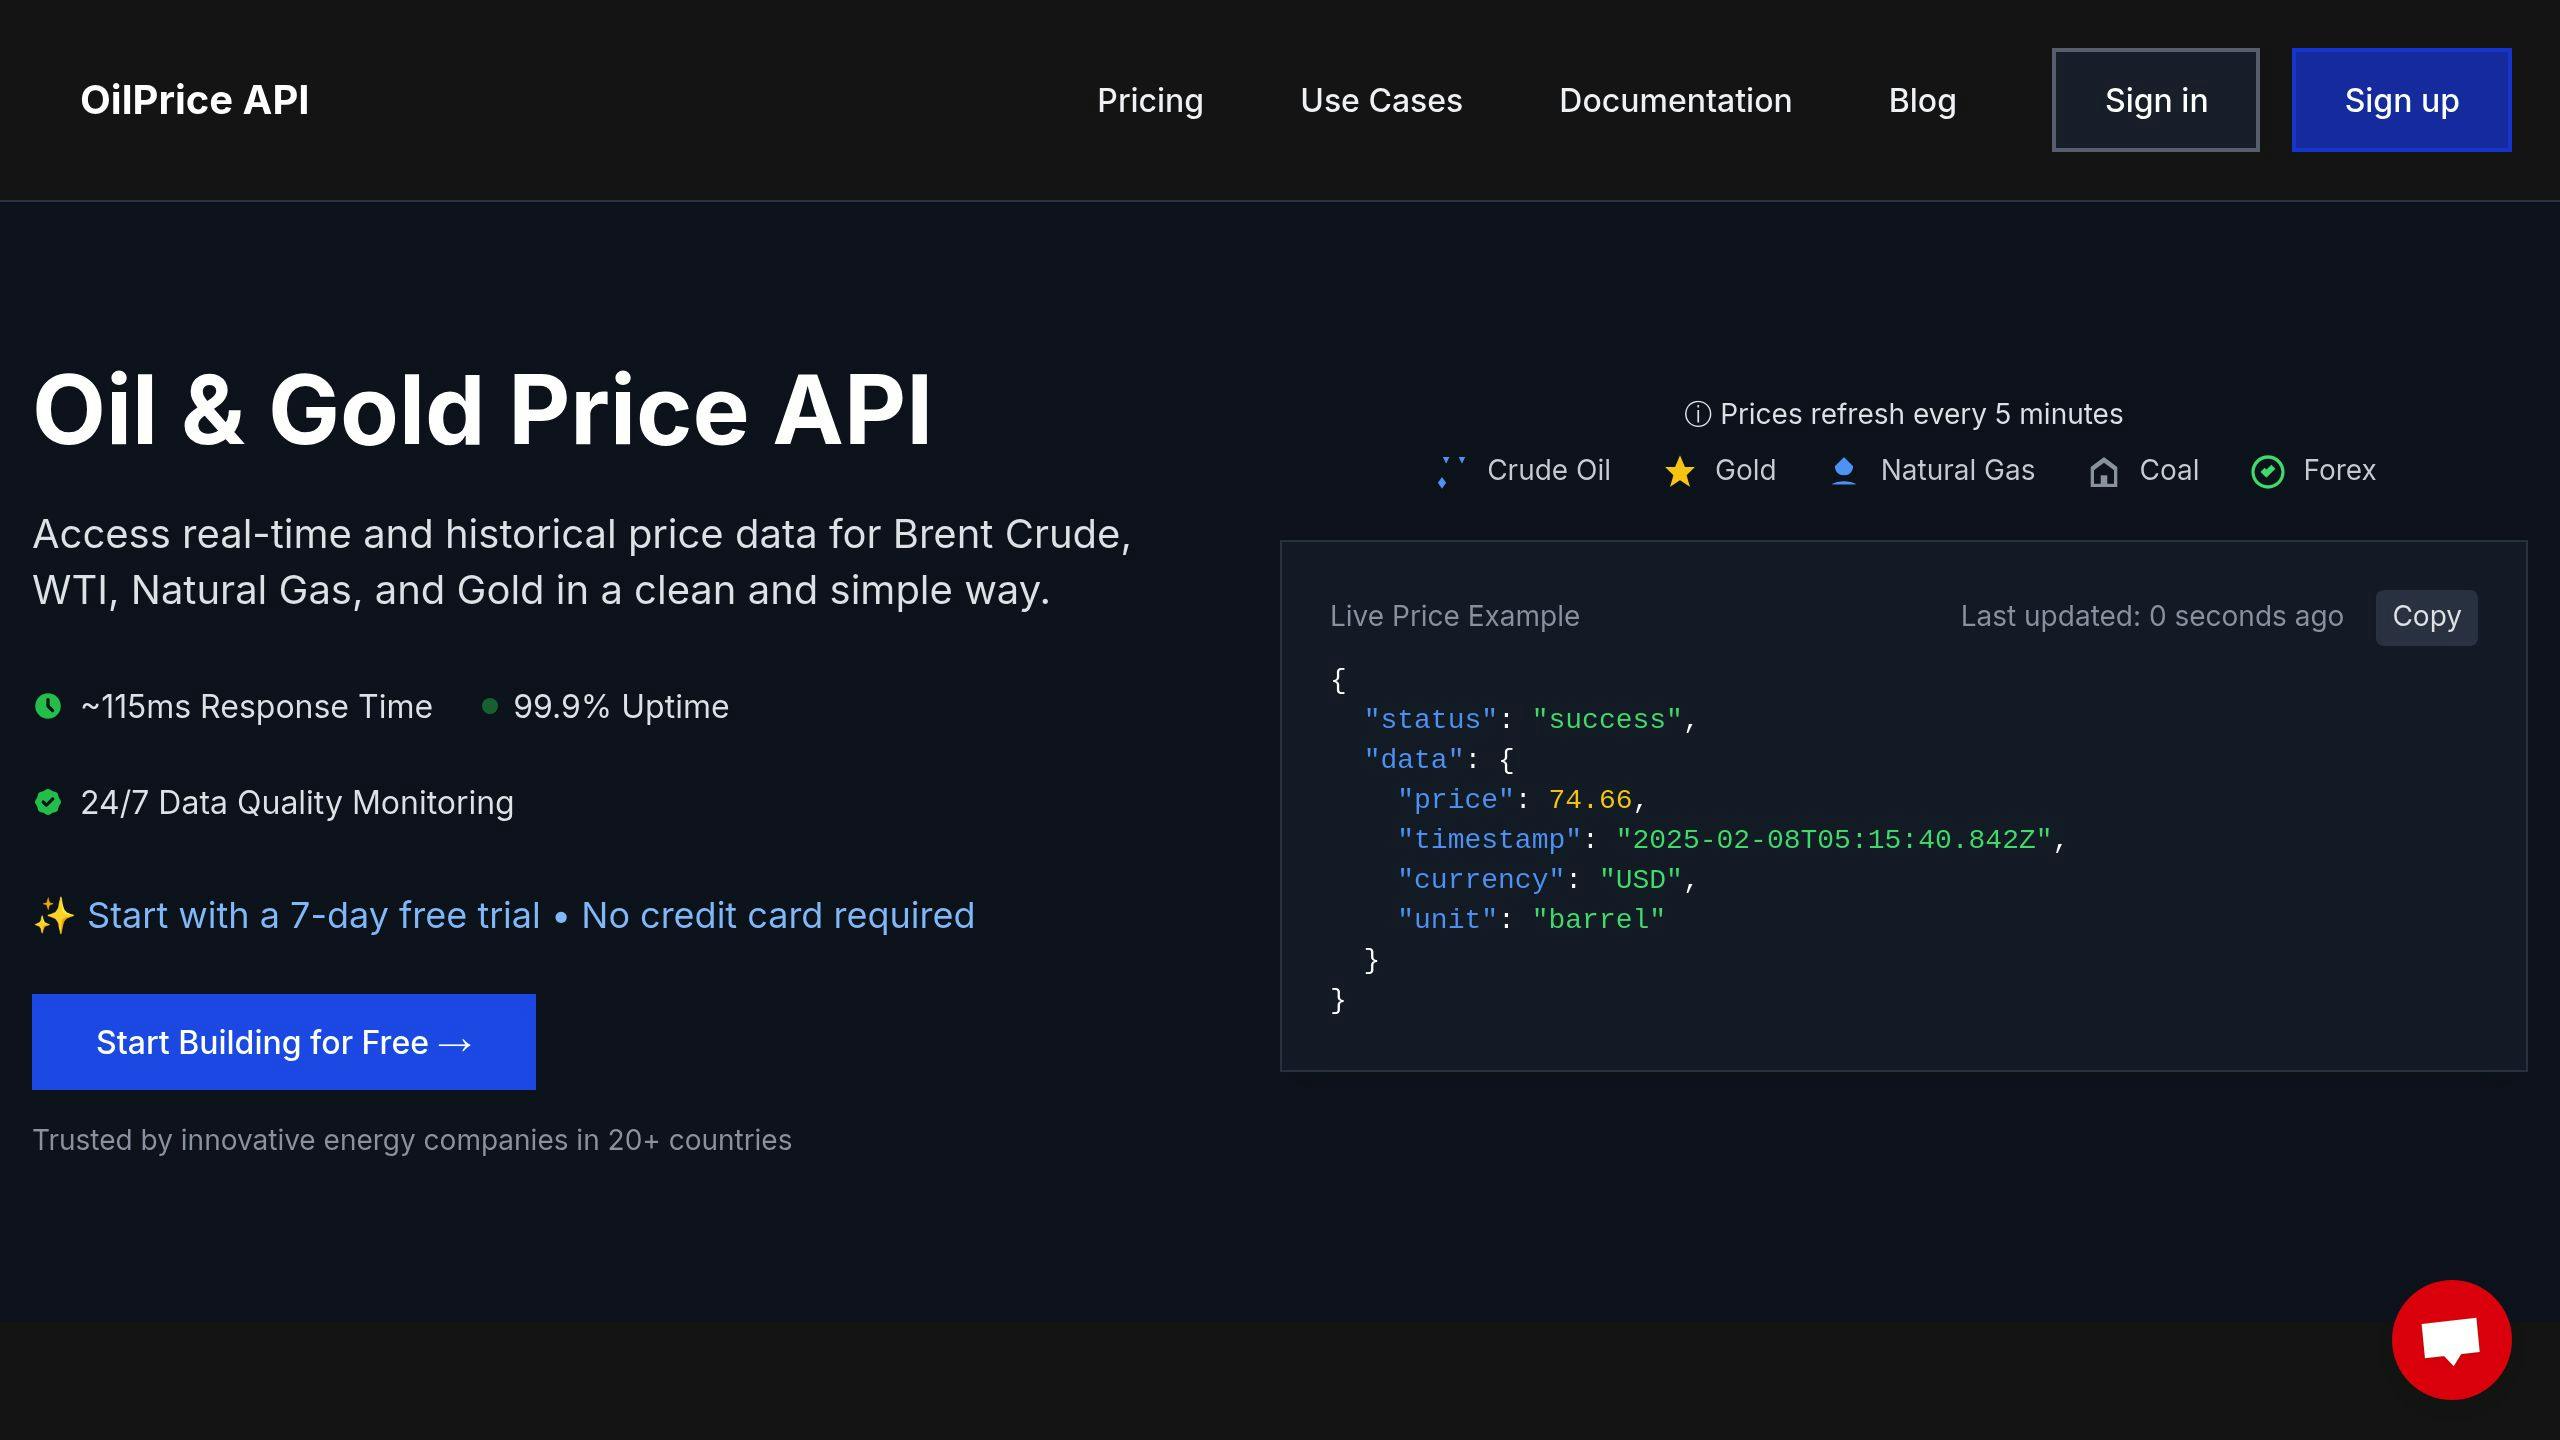
OilpriceAPI supports Ichimoku Cloud analysis by delivering accurate data for components like Tenkan-sen and Kijun-sen. Its historical data is especially useful for testing and validating trading signals.
| Feature | How It Helps with Ichimoku Analysis |
|---|---|
| Real-time Data | Ensures instant updates to cloud elements |
| Historical Data | Enables trend analysis and backtesting |
| Multiple Timeframes | Facilitates analysis across trading periods |
Setting Up OilpriceAPI
Here’s how to get started with OilpriceAPI:
- Sign up to obtain API credentials.
- Integrate the data feed into your trading tools.
- Set up your preferred timeframes and update intervals.
- Regularly check the data for accuracy.
To maximize performance, consider these tips:
- Regularly verify the accuracy of the data.
- Keep an eye on response times for smoother operations.
- Use price movement alerts to stay informed.
"The accuracy of gold price data from OilpriceAPI is crucial for reliable Ichimoku Cloud analysis. Inaccurate data can lead to misleading signals and poor trading decisions."
Summary
The Ichimoku Cloud, with components like the Tenkan-sen and Kijun-sen, helps traders identify key trends and make informed decisions in gold trading. For example, when the price moves above an orange cloud and a "Golden Cross" forms between the Tenkan-sen and Kijun-sen, it often indicates a strong upward trend [2]. Whether signals are bullish or bearish depends on how the price interacts with the cloud [1].
Accurate gold price data is crucial for effective Ichimoku Cloud analysis. Traders can monitor these key signal points:
| Signal Type | Indication |
|---|---|
| Strong Bullish | Price above the orange cloud; stop-loss placed below the cloud |
| Strong Bearish | Price below the purple cloud; stop-loss placed above the cloud |
| Neutral | Price within the cloud; wait for a clear breakout before taking action |
The Ichimoku Cloud adjusts to changing market conditions, providing updated support and resistance levels to guide trading decisions [3].
To improve results, traders should analyze multiple timeframes and confirm signals by examining how different Ichimoku components interact. Its forward-looking design allows traders to anticipate market movements and tweak strategies accordingly.
Patience is key - waiting for clear signals can help avoid false entries and unnecessary losses [1]. By mastering the Ichimoku Cloud and using reliable data, traders can make more confident and precise decisions.
FAQs
This section answers common questions to help traders use Ichimoku Cloud analysis for tracking gold price trends.
What is a strong buy signal in Ichimoku?
A strong buy signal happens when gold prices move above the cloud, the cloud turns orange, and the Tenkan-sen crosses above the Kijun-sen.
| Signal Component | Bullish Condition |
|---|---|
| Cloud Color | Orange (Senkou A above Senkou B) |
| Price Position | Above the cloud |
| Confirmation | Tenkan-sen crosses above Kijun-sen |
How do I confirm trend strength?
You can confirm trend strength by observing how the Ichimoku components interact [1]. Indicators of a strong trend include:
- Gold prices staying consistently above or below the cloud
- The cloud becoming thicker in the direction of the trend
- The Lagging Line (Chikou Span) aligning with the trend direction
When should I avoid taking trades?
Avoid trading when gold prices are inside the cloud. This often signals conflicting trends, making it better to wait for clearer alignment [1].
How can I use OilpriceAPI with Ichimoku analysis?
OilpriceAPI provides real-time gold price data, which is useful for applying Ichimoku analysis. Its historical data also helps with backtesting strategies. Reliable data from OilpriceAPI can support more informed trading decisions [OilpriceAPI].