China and India are far ahead of every other market. Using full-year 2023 demand data, China ranks first at 959.3 tonnes, India is second at 747.5 tonnes, and the rest trail by a large margin.
If you want the short version, here it is:
- China and India lead because jewelry and bars/coins both stay strong.
- The United States, Thailand, Vietnam, Iran, and Türkiye lean more toward investment buying.
- Saudi Arabia and the UAE lean more toward jewelry demand.
- Egypt sits in between, with buying tied to both jewelry and store-of-value demand.
- This ranking uses consumption only: jewelry, bars and coins, and industrial use.
- It does not include mine supply, gold reserves, or central bank purchases.
What I take from the data is simple: volume alone does not tell the whole story. Some countries buy gold for weddings and gifts. Others buy it to protect savings when inflation runs hot or local currencies fall. That is why two countries with much lower tonnage than China or India can still matter a lot in the global market.
Countries Ranked by Gold Consumption
Quick Comparison
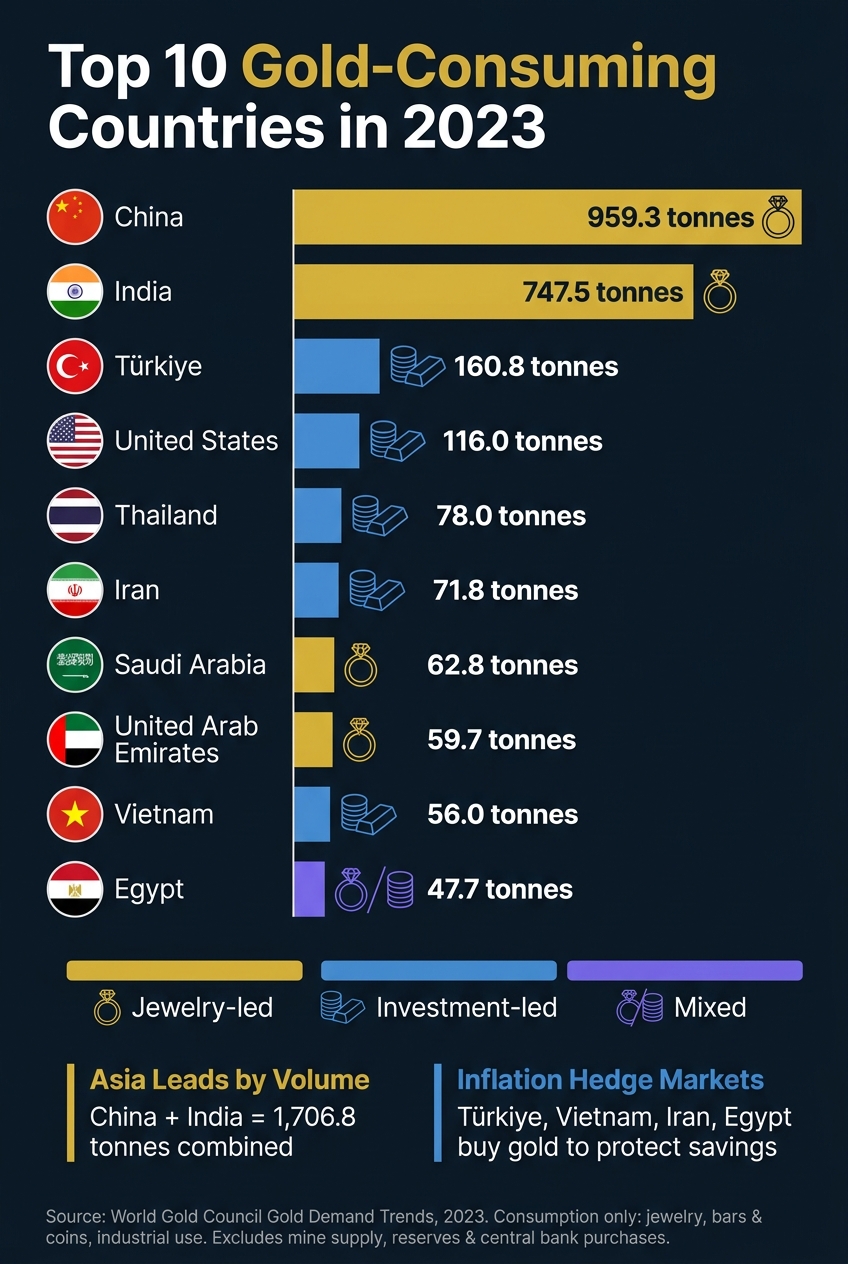
Top 10 Gold-Consuming Countries in 2023: Demand by Volume & Pattern
| Rank | Country | 2023 Total Demand | Main Pattern | Main Driver |
|---|---|---|---|---|
| 1 | China | 959.3 tonnes | Jewelry-led | Jewelry plus bullion buying |
| 2 | India | 747.5 tonnes | Jewelry-led | Festivals, weddings, and investment demand |
| 3 | United States | 116.0 tonnes | Investment-led | Bars and coins |
| 4 | Türkiye | 160.8 tonnes | Investment-led | Inflation and currency pressure |
| 5 | Saudi Arabia | 62.8 tonnes | Jewelry-led | Weddings, gifting, and jewelry demand |
| 6 | United Arab Emirates | 59.7 tonnes | Jewelry-led | Jewelry plus bars and coins |
| 7 | Thailand | 78.0 tonnes | Investment-led | Bars and coins |
| 8 | Vietnam | 56.0 tonnes | Investment-led | Inflation and currency concerns |
| 9 | Iran | 71.8 tonnes | Investment-led | Store-of-value buying |
| 10 | Egypt | 47.7 tonnes | Mixed | Jewelry plus savings protection |
One quick note: the article’s numbered order and the tonnage figures do not fully match. For example, Türkiye (160.8 tonnes) is listed below the United States (116.0 tonnes), even though its total is higher. So I’d read this piece as a country overview based on 2023 demand themes, not a strict highest-to-lowest list.
If you’re reading this to understand gold demand fast, the main point is this: Asia leads on scale, the Gulf leans jewelry-heavy, and several other markets buy gold mainly as a way to hold value.
What Drives Gold Consumption Worldwide
Gold consumption comes down to three main uses: jewelry, bars and coins, and industrial demand. Those three forces help explain why buying patterns look so different from one country to the next.
Jewelry accounts for the biggest share of demand, especially in India, China, and parts of the Middle East. In those markets, buying often jumps during festivals and wedding seasons.
Bars and coins tend to pick up when investors want a hedge against inflation, weak currencies, or geopolitical tension. Demand also gets a lift when real interest rates move lower.
Industrial demand is smaller, but it stays fairly steady. Gold is used in electronics, aerospace, and medical applications.
Once you have those demand drivers in mind, the country-by-country ranking for 2023 starts to make more sense. You’re not just looking at one kind of buyer. You’re seeing how consumer habits, investor behavior, and industry all mix together.
There’s also a pricing angle worth noting. OilpriceAPI offers real-time and historical gold price data through a JSON REST API. Endpoints such as /v1/prices/latest?by_code=GOLD_USD and /v1/prices/historical can help track price moves alongside shifts in demand. That adds useful context for the country rankings that follow.
1. China
China leads global gold consumption, with demand pushed by jewelry buying and investment purchases.
2023 Total Gold Demand
China's total gold demand reached 959.3 tonnes in 2023. That massive volume keeps the country firmly in first place, with most demand coming from jewelry and bars and coins.
Jewelry Demand
Jewelry is the biggest driver of gold demand in China. A lot of that comes down to long-standing buyer preference, plus seasonal shopping tied to holidays, weddings, and gift-giving.
Bars and Coins Demand
Bars and coins stayed strong in 2023 as buyers looked for a hedge against inflation, currency weakness, and uncertainty. When markets feel shaky, physical gold often looks like a safer place to park money.
Industrial Demand
Industrial use remained small and stable.
Takeaway: China stays ahead because of the sheer size of its jewelry market and steady investment buying.
2. India
After China, India stands out as one of the clearest cases where gold demand is shaped by both tradition and investing behavior. It ranks second in the world, with demand led by jewelry and investment buying. In India, gold is more than a purchase. It also works as a financial hedge.
2023 Total Gold Demand
India's total gold demand reached 747.5 tonnes in 2023, which kept the country firmly in second place behind China.
Jewelry Demand
Jewelry demand is tied closely to festivals, weddings, and long-held consumer preference. That same pull often carries over into investment buying, especially in bars and coins.
Investment Demand
Indian buyers also turn to gold as protection against inflation and rupee weakness. Bars and coins take in a meaningful share of that investment demand as well.
Industrial Demand
Industrial use is small when compared with jewelry and investment demand.
Takeaway: India's demand blends culture and finance: jewelry leads, investment follows, and festival buying can lift global demand.
3. United States
The United States ranks third in 2023, and its gold demand looks different from what we see in China and India. In those markets, buying often follows long-standing seasonal and social patterns. In the U.S., demand is shaped much more by investment behavior. Inflation expectations and interest-rate moves tend to steer buying decisions, which makes the U.S. a clear contrast with the tradition-led markets above.
2023 Total Gold Demand
U.S. gold demand totaled 116.0 tonnes in 2023. Bars and coins led the market, with jewelry next, while industrial use remained a small part of total demand.
Jewelry Demand
U.S. jewelry demand tends to follow consumer spending more than seasonal or tradition-based buying cycles. When shoppers feel confident and keep spending, jewelry demand usually holds up better.
Bar and Coin Investment Demand
Bars and coins are the main driver of U.S. demand. Many buyers turn to gold as a hedge against inflation. At the same time, higher real interest rates often cool purchases because gold does not pay a yield.
Industrial Demand
Industrial use is limited but steady.
Takeaway: U.S. gold demand is investor-led and sensitive to rate moves. That sets it apart from the more tradition-driven demand profiles that follow.
4. Türkiye
Unlike the U.S., gold demand in Türkiye is driven less by discretionary investing and more by the need to protect savings. In 2023, demand was pushed by high inflation, weakness in the lira, and safe-haven buying. That pressure showed up in different ways across jewelry, bars, and coins.
2023 Total Gold Demand
Türkiye's total gold demand was 160.8 tonnes in 2023.
Jewelry Demand
Jewelry is a major part of Türkiye's gold market. Gold jewelry has deep roots in Turkish customs and gift-giving, which helps support steady demand.
Bar and Coin Investment Demand
Investment demand stood out in 2023. With inflation running high and the lira under pressure, bars and coins became an attractive way for people to hold value.
Industrial Demand
Industrial demand plays a smaller role than jewelry and investment demand in Türkiye.
Takeaway: Türkiye's gold demand is largely a response to currency and inflation risk.
5. Saudi Arabia
Saudi Arabia’s gold market looks a lot like a classic Gulf market: jewelry comes first. Demand leans heavily toward jewelry, while bar-and-coin buying adds support and industrial use stays small.
2023 Total Gold Demand
Saudi Arabia’s total gold demand reached 62.8 tonnes in 2023. Jewelry made up the biggest share of that total.
Jewelry Demand
Jewelry is the main driver of Saudi Arabia’s gold market. Demand stays steady, helped by weddings and gift-giving, which continue to play a big role in buying patterns.
Bar and Coin Investment Demand
Bar and coin demand gets support from people looking to hedge against inflation and from currency weakness.
Industrial Demand
Industrial demand is minimal.
Takeaway: Saudi Arabia’s demand is jewelry-led, with investment support and minimal industrial use. The UAE follows the same regional pattern.
sbb-itb-a92d0a3
6. United Arab Emirates
Like Saudi Arabia, the UAE’s gold market is driven mainly by jewelry, with bars and coins adding an investment layer.
In 2023, that mix added up to a national total of 59.7 tonnes.
2023 Total Gold Demand
The UAE’s total gold demand was 59.7 tonnes in 2023.
Jewelry Demand
Jewelry demand tends to move with seasonal buying, gift-giving, and local shopping habits tied to weddings and holidays.
Bar and Coin Investment Demand
Bars and coins appeal to people who want a hedge against inflation, weaker currencies, and periods of uncertainty.
Industrial Demand
Industrial demand is small.
Takeaway: The UAE’s gold market is led by jewelry, while bars and coins add investment demand. Industrial use remains small.
7. Thailand
Thailand shifts the focus in Southeast Asia toward investment-led gold buying. That makes it different from the jewelry-led Gulf markets mentioned above.
2023 Total Gold Demand
Thailand's total gold demand was 78.0 tonnes in 2023. Bars and coins led the market, while jewelry added a smaller share. In simple terms, most of the total came from investment buying first, with jewelry next.
Jewelry Demand
Jewelry makes up a smaller but steady part of Thailand's gold demand. It matters, but it doesn't lead the market.
Bar and Coin Investment Demand
Bars and coins drive most investment demand in Thailand's gold market. That's the main story here: people buy gold less as adornment and more as an asset.
Industrial Demand
Industrial use is limited.
Takeaway: Thailand's gold market is investment-led, with jewelry secondary and industrial use minimal.
8. Vietnam
After Thailand, Vietnam stands out as another market where people buy more physical gold than jewelry. This is an investment-led market, with physical gold often used as a hedge against inflation and currency devaluation.
2023 Total Gold Demand
Vietnam's total gold demand reached 56.0 tonnes in 2023.
Jewelry Demand
Jewelry plays a smaller role than investment demand.
Bar and Coin Investment Demand
Bars and coins lead Vietnam's gold market. Investors turn to physical gold as a hedge against inflation and currency devaluation.
Industrial Demand
Industrial demand is limited.
Takeaway: That keeps Vietnam near the top tier of investment-sensitive gold markets.
9. Iran
After the investment-led markets in Southeast Asia, Iran shows a similar pattern, but under much tighter economic strain.
Iran’s gold market is driven mainly by bars and coins. Jewelry still matters, but it comes second, and industrial use stays small. High inflation and a weak currency have pushed many buyers toward physical gold as a store of value.
2023 Total Gold Demand
Iran’s total gold demand reached 71.8 tonnes in 2023.
Jewelry Demand
Jewelry still holds an important place in Iranian life, but it sits behind investment buying.
Bar and Coin Investment Demand
Bars and coins lead Iran’s market as people hedge against high inflation and sharp currency weakness.
Industrial Demand
Industrial demand makes up a much smaller share of Iran’s gold consumption than jewelry and investment demand.
Takeaway: Iran’s gold demand is investment-led, with bars and coins doing most of the heavy lifting.
Egypt follows with a more jewelry-heavy mix.
10. Egypt
Egypt rounds out the ranking with a gold market shaped less by discretionary spending and more by currency protection. In plain terms, people often buy gold there to help shield savings when the local currency weakens. Inflation adds more pressure, and that helps explain why gold stays in demand as a store of value.
2023 Total Gold Demand
Egypt's total gold demand reached 47.7 tonnes in 2023.
Jewelry Demand
Jewelry keeps a steady role in Egypt's gold market. Wedding customs and gift-giving continue to support demand, even as buyers stay focused on preserving household wealth.
Bars and Coins Demand
When the currency loses purchasing power, many buyers shift toward physical gold as a way to protect savings.
Industrial Demand
Industrial use is minimal.
Takeaway: Egypt's gold demand is defensive, led by currency weakness and store-of-value buying.
The next section compares all 10 countries side by side.
Country Comparison at a Glance
The table below sums up the 2023 ranking by demand mix and total volume. It gives you a fast read on the top gold-consuming countries, how people buy gold there, and what tends to push demand.
| Country | 2023 Total Demand | Demand Pattern | What Drives Demand |
|---|---|---|---|
| China | 959.3 tonnes | Jewelry-led | Jewelry and bullion buying |
| India | 747.5 tonnes | Jewelry-led | Jewelry and bullion buying |
| United States | 116.0 tonnes | Investment-led | Bars and coins, jewelry, and limited industrial use |
| Türkiye | 160.8 tonnes | Investment-led | Bars and coins as an inflation and currency hedge |
| Saudi Arabia | 62.8 tonnes | Jewelry-led | Jewelry and bars/coins |
| United Arab Emirates | 59.7 tonnes | Jewelry-led | Jewelry and bars/coins |
| Thailand | 78.0 tonnes | Investment-led | Bars and coins, with jewelry secondary |
| Vietnam | 56.0 tonnes | Investment-led | Protection against currency devaluation and inflation |
| Iran | 71.8 tonnes | Investment-led | Bars and coins as a hedge against inflation and currency weakness |
| Egypt | 47.7 tonnes | Mixed demand | Jewelry and bars/coins driven by currency protection |
A clear split shows up here. China and India lead by volume because jewelry buying plays such a big role, along with strong bullion demand. By contrast, places like Türkiye and Vietnam lean more toward investment buying, where gold acts like a financial shield when inflation bites or local currency weakens.
The source notes below explain how these demand patterns are measured.
Data Sources and Caveats
This ranking uses 2023 country-level gold consumption data from the World Gold Council (WGC) Gold Demand Trends reports. Where WGC country coverage is incomplete, country-level market reports fill in the gaps. Together, these sources support the 2023 consumption ranking shown next.
One thing to be clear about: these rankings cover consumption demand only. That means:
- jewelry
- bars and coins
- industrial use
They do not include mine output, reserves, or central bank buying.
There’s also some messiness in the data. Category splits aren’t equally complete across all countries, so some country-level figures need a careful read. On top of that, local currency moves can change domestic gold prices even when the U.S. dollar gold price barely moves.
Short-term demand can shift for another reason too. ETF flows and speculative positioning in futures markets can push things around for a while, even when physical demand tells a different story. So if a tonnage figure looks precise, it’s still best to treat it as an estimate.
These caveats help set up the main takeaways below.
Key Takeaways
Two demand models stand out: jewelry-led consumption in China, India, and the Gulf, and hedge-driven buying in markets under inflation pressure.
China and India lead gold consumption because jewelry buying and bullion demand are deeply rooted in both places. In the Gulf - especially Saudi Arabia and the UAE - the market also leans heavily toward jewelry consumption.
The United States is smaller by volume and leans more toward investment demand, with limited industrial use. In Türkiye, Vietnam, Iran, and Egypt, buying bars and coins has become a recurring response to inflation and currency weakness.
These patterns give a clearer view of the market than volume alone.
FAQs
Why does the headline say 2026 if the data is from 2023?
The headline says 2026 because the article was published in 2026, even though it uses 2023 consumption data for the analysis.
That approach makes sense. Using established data gives the article a clear, accurate look at past trends while still helping readers understand how the market is behaving in the current moment.
Why isn’t this a strict highest-to-lowest ranking?
Gold demand comes from a few different places: jewelry, bars, coins, and industrial use.
That matters because two countries can consume similar amounts of gold for completely different reasons. One market may lean heavily on jewelry, while another may be driven by investment buying or factory demand.
Regional conditions also shape the picture. Central bank policy, local economic instability, and buyer preferences can all push demand in different directions. So if you look only at volume rankings, you can miss what's happening underneath the numbers - and the economic forces shaping each country's gold use.
What counts as gold consumption in this list?
In this list, gold consumption means demand across jewelry, technology, and investment.
That covers physical gold used for jewelry making, industrial tech uses, and investment products like bars and coins.
It also includes major central bank purchases, since gold serves as a store of value and a reserve asset.