Gold did not move up in a straight line. It moved in long swings tied to inflation, real interest rates, and big policy shifts.
If I had to boil this article down to the core idea, it’s this:
- Gold did best when inflation was hot and real yields were low or falling
- Gold did worst when real yields were high and the U.S. dollar was firm
- The biggest turning points came from regime changes, like the end of Bretton Woods, the 2008 crisis, and the pandemic period
- Price action was often sharp at cycle tops and bottoms, even inside long-term uptrends
From $35 per ounce in 1971 to more than $5,000 in February 2026, gold’s long-run move looks simple at first glance. But the path was anything but simple. I see five main cycles:
- 1971–1980: strong bull market driven by inflation and negative real rates
- 1980–2001: long weak stretch with high real yields and poor real returns
- 2001–2011: decade-long bull run helped by a weak dollar, low real rates, and crisis demand
- 2011–2018: correction phase as yields moved up and fear faded
- 2019–2026: new uptrend shaped by pandemic money growth, inflation, and central bank buying
Quick comparison
| Cycle | Main Direction | Main Driver | General Pattern |
|---|---|---|---|
| 1971–1980 | Up | High inflation, negative real rates | Strong but very volatile |
| 1980–2001 | Flat/down | High real yields, disinflation | Long slump |
| 2001–2011 | Up | Falling real rates, weak dollar, crisis fear | Steady bull market |
| 2011–2018 | Down/sideways | Rising real yields, stronger dollar | Post-peak reset |
| 2019–2026 | Up | Pandemic shock, reserve shifts, inflation | Strong but choppy |
For me, the big lesson is simple: gold is less about averages and more about the regime. If you want to understand where it may go next, watch real yields, inflation, and central bank behavior first.
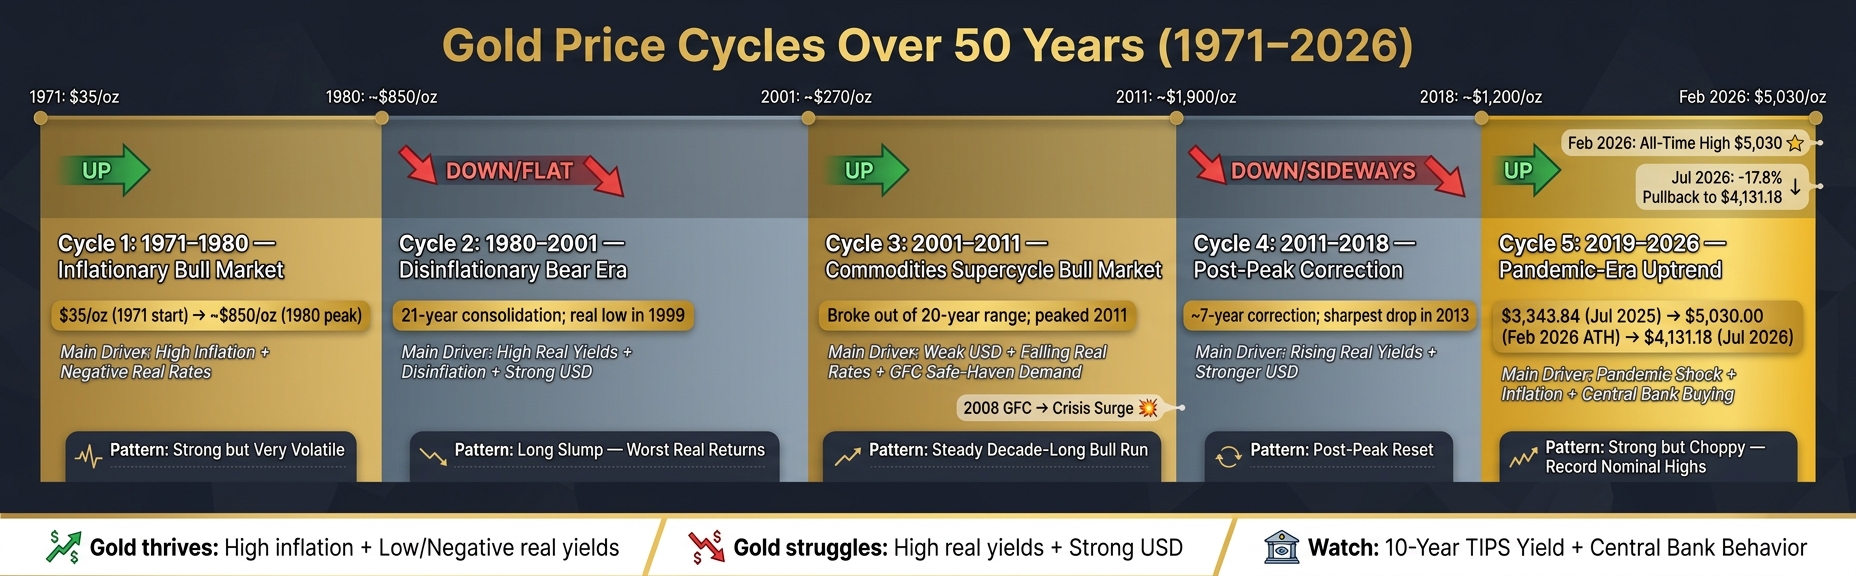
Gold Price Cycles Over 50 Years: Key Drivers & Trends (1971–2026)
1. 1970s Inflationary Bull Market (1971–1980)
Trend Length
The 1970s gold bull market ran for about nine years, from 1971 to 1980.
Volatility and Regime Shift
Once gold started trading freely, volatility jumped. The end of dollar convertibility in 1971 marked gold’s first free-market regime. In plain English, pricing was no longer tied to a fixed anchor and started moving with market forces instead.
That period became the first modern test of gold as an inflation hedge.
Inflation and Real Rates
The main drivers were high inflation, negative real rates, and geopolitical risk. When real rates turn negative and inflation stays high, holding gold costs less in relative terms. That helped push safe-haven demand higher.
This was gold’s first modern cycle, and it set the inflation-and-real-rates pattern that showed up again in later periods. From that point on, gold kept reacting to inflation, real rates, and policy credibility.
sbb-itb-a92d0a3
2. Disinflationary Bear and Range-Bound Era (1980–2001)
Trend Length
After 1980, the macro picture changed in a big way. Gold no longer had the inflation boost that drove the 1970s. Following its 1980 peak, gold then spent 21 years stuck in a long consolidation phase before finally breaking out in 2001. In real terms, the low point came in 1999.
Volatility and Drawdowns
During most of the 1980s and 1990s, gold moved sideways or drifted lower in nominal terms. At the same time, inflation-adjusted returns kept slipping, which means gold was losing purchasing power through much of the period.
Inflation and Real Rates
This era was mostly about opportunity cost. Gold doesn't pay yield, so when real rates stayed positive, Treasury assets looked more attractive. That pulled demand away from gold. Falling inflation also stripped away much of gold's draw as an inflation hedge.
Market Regime Shifts
The 1980 peak marked a sharp shift away from the inflation shock of the 1970s and into a disinflationary, more price-stable period. On top of that, central bank sales and a strong U.S. dollar through most of the era added steady selling pressure.
| Phase | Timeframe | Key Drivers | Market Outcome |
|---|---|---|---|
| Post-1980 Peak | Early 1980s | Rising real rates, falling inflation | Bear market begins |
| Consolidation Era | 1980s–1990s | Disinflation, dollar strength | Price stays range-bound and loses real value |
| Cycle Trough | 1999 | High real yields, low investor interest | Multi-decade lows in real terms |
3. Commodities Supercycle and Secular Bull Market (2001–2011)
Trend Length
After bottoming in 1999, gold broke out of a 20-year trading range and moved into a bull market that lasted about a decade. It rose alongside the commodities supercycle, helped by strong global demand, a weaker U.S. dollar, and loose monetary policy.
Volatility and Drawdowns
Compared with most commodities, gold was less erratic and held a steadier climb. Even the 2008 financial crisis didn't knock it out of trend. If anything, the crisis pulled in more safe-haven demand and added fuel to the move.
Rates also played a big part in keeping that trend in place.
Inflation and Real Rates
One of the main forces behind this run was the change in real interest rates. That backdrop grew stronger after 2001 and then again after 2008, when central banks rolled out quantitative easing. Lower real yields, higher inflation expectations, and fears of currency debasement gave gold a strong tailwind through much of the decade.
Market Regime Shifts
This cycle stood out because of two big structural shifts. First, central banks changed direction. After years of coordinated gold sales in the 1990s, they became net buyers, flipping a source of supply pressure into a source of demand.
Second, the 2008 global financial crisis expanded gold's role. It was no longer seen just as an inflation hedge; it also became a hedge against system-wide financial stress. The 2011 peak was followed by a sharp correction as real yields moved up and risk sentiment improved. That turn led into the post-2011 correction.
| Phase | Timeframe | Key Drivers | Market Outcome |
|---|---|---|---|
| Cycle Begins | 2001 | Weak dollar, falling real rates | Gold breaks out of a long consolidation |
| Crisis Surge | 2008–2011 | GFC, QE, safe-haven demand | Rapid price acceleration |
| Cycle Peak | 2011 | Monetary expansion, central bank buying | Major cyclical high reached |
| Correction Begins | 2013 | Rising real yields, better risk appetite | Sharp nominal price decline |
4. Post-Peak Correction and Normalization Phase (2011–2018)
Trend Length
After the 2011 peak, gold moved out of its crisis-driven run and into a long normalization period. It then spent about seven years giving back the crisis premium that had built up from 2008 to 2011.
Volatility and Drawdowns
2013 was the sharpest drop of the cycle. It reset market mood and shaped the rest of this phase.
Inflation and Real Rates
This wasn’t a replay of the 1970s. The main driver of the decline was higher real yields, which made holding gold less attractive because it doesn’t pay income.
Market Regime Shifts
Three forces set the tone here: higher real yields, a stronger dollar, and weaker crisis demand. Put simply, the backdrop flipped. A firmer U.S. dollar also made dollar-priced gold costlier for buyers using other currencies. At the same time, central bank selling and slower reserve accumulation added more pressure on prices.
The table below shows how the main drivers reversed from the earlier bull market.
| Driver | 2001–2011 Effect | 2011–2018 Effect |
|---|---|---|
| Real interest rates | Falling - supported gold | Rising - pressured gold |
| U.S. dollar | Weaker - boosted gold | Stronger - weighed on gold |
| Market sentiment | Crisis fear, safe-haven demand | Less crisis-driven, changing rate expectations |
| Central bank policy | Expansive - supported gold | Less supportive - reduced demand |
Gold Price 1915-2026 in USD per Ounce, Inflation Adjusted
5. Pandemic-Era Uptrend and Regime Shift (2019–2026)
After the 2011–2018 correction, gold started a new climb. This time, the move wasn't driven by inflation alone. Pandemic shock, swings in real yields, and reserve diversification all played a big part.
Trend Length
This cycle has lasted about seven years, and it has moved faster than the 2001–2011 bull market.
The most dramatic jump happened over just seven months. Gold went from $3,343.84 in July 2025 to a record $5,030.00 in February 2026. That's a gain of more than 50%.
Volatility and Drawdowns
The rally didn't move in a straight line.
After hitting its February 2026 peak, gold fell about 17.8% to $4,131.18 by July 2026. That five-month pullback was sharp, but even then, the year-over-year gain still stood at +23.55% or $787.34.
Inflation and Real Rates
This cycle was shaped by pandemic-era monetary expansion, inflation during and after the pandemic, and shifts in real yields. In that setting, gold acted as a hedge against currency debasement.
Higher real yields in the mid-2020s put pressure on gold at times, but the broader uptrend stayed in place.
Market Regime Shifts
What makes this period stand apart from earlier cycles is the range of demand drivers behind it.
Central banks, especially in emerging markets, have been buying gold at a steady pace as part of reserve diversification away from the U.S. dollar. At the same time, the Gold/Oil ratio climbed to 57.54 barrels per ounce in July 2026, far above its old 15–20 range.
That's a big gap. It suggests gold is trading in a different macro regime, one that has pulled away from its older commodity pattern.
| Date | Gold Price (USD/oz) | Context |
|---|---|---|
| July 2025 | $3,343.84 | 12-month low |
| October 2025 | $4,068.29 | Rising trend |
| January 2026 | $4,703.61 | Continued rally |
| February 2026 | $5,030.00 | All-time high |
| June 2026 | $4,235.58 | Post-peak correction |
| July 2026 | $4,131.18 | Current level |
Source: OilpriceAPI 12-Month Price History
These shifts set up the cross-cycle comparison in the next section.
How Gold Behaved Across Trends, Volatility, Inflation, and Rate Cycles
Across the five cycles above, three forces mattered most: real rates, inflation, and regime shifts.
Gold’s weakest run was 1980–2001, while its strongest sustained gains showed up in 1971–1980 and 2001–2011.
Volatility changed with the backdrop. The 1970s were the most erratic. The 2001–2011 bull market was steadier. And 2019–2026 has been strong, but choppy. Gold hit a 12-month high of $5,030.00 per ounce in February 2026 and was trading at $4,131.18 in July 2026, up 23.55% year over year. Annualized volatility sits at 24.5%, which puts it in the middle of the range.
Gold often climbs when the Fed pauses or starts cutting, and it tends to weaken during hard hiking phases. Rising real yields usually weigh on gold. If you want one rate signal to watch, the 10-year TIPS yield is the clearest one.
The table below boils the cycle-by-cycle pattern down to the main points.
| Criterion | Highest Reading | Lowest Reading | Typical Macro Conditions | Investor Takeaway |
|---|---|---|---|---|
| Trend Length | 1980–2001 (21 years, longest) | 2011–2018 (shortest correction) | Negative or falling real rates tend to support bull markets; high real yields can drag out bear phases | Gold makes more sense as a long-term allocation; short-term swings are often driven by sentiment |
| Volatility & Drawdowns | 1971–1980 (highest volatility) | 2001–2011 (steadier bull) | Big regime changes often push volatility higher | High volatility can show up right before a regime shift |
| Inflation & Real Rates | 1971–1980 (high inflation) | 1980–2001 (high real rates) | Gold tends to struggle when yield-bearing assets offer strong real returns | The 10-year TIPS yield is a key risk signal |
| Market Regime Shifts | 2019–2026 (pandemic-era uptrend) | 2011–2018 (normalization) | QE-to-tightening transitions can trigger sharp corrections | Regime shifts can break gold’s usual inverse link with the U.S. dollar |
Gold in Each Era: Pros and Cons
After the cycle-by-cycle review, this table strips each era down to the practical trade-off for investors. The pattern shows up again and again: gold tends to help most when inflation and policy risk climb faster than real yields.
This table shows when gold paid off for patient holders and when it did the opposite.
| Cycle | Main Pros | Main Cons | Best Supporting Conditions | Primary Risk |
|---|---|---|---|---|
| 1971–1980 | Exceptional inflation protection; hedge against the new floating-rate regime | Extreme price volatility | High inflation; geopolitical instability; USD weakness | Policy shocks, especially aggressive rate hikes |
| 1980–2001 | Portfolio diversification; long-term store of value | High opportunity cost vs. equities; little real return for two decades | Low inflation; high real yields; strong stock markets | Extended loss of real purchasing power |
| 2001–2011 | Massive capital appreciation; strong crisis hedge during GFC and QE expansion | No yield | Loose policy and crisis demand; dollar weakness | Sharp corrections as risk sentiment normalized |
| 2011–2018 | Store of value during currency weakness; portfolio diversification | Post-peak mean reversion; sensitive to tapering | Economic recovery; improving risk appetite | Nominal price crashes, including the steep 2013 correction |
| 2019–2026 | Record nominal highs; hedge against pandemic-era monetary expansion and inflation waves | Higher drawdown risk near cycle tops | Pandemic stimulus; geopolitical tensions; sustained inflation | Aggressive rate hikes; sustained high real yields reducing gold's appeal vs. bonds |
Gold's core trade-off is pretty simple: it pays no income, so it usually works best when inflation is high and real yields are low.
Conclusion
Across the five cycles above, the same pattern keeps showing up: gold made its biggest moves when inflation ran hot, real yields dropped, and faith in policy started to slip.
You can see it at each major turning point. The 1970s and 2001–2011 were the strongest cycles. By contrast, 1980–2001 was the weakest.
The latest cycle fits that same pattern. Gold climbed from $3,343.84 in July 2025 to $5,030.00 in February 2026, then fell back to $4,131.18 by July 2026.
That’s why a long-run average can blur what’s going on. For gold, the part that matters most is the regime investors are pricing, not the average.
FAQs
Why do real yields matter so much for gold?
Real yields matter for gold because gold doesn't pay interest or dividends. So the big issue is opportunity cost.
When real interest rates are low or negative, holding gold tends to feel less costly. You're not giving up much income by owning it, which can make gold look more appealing.
When real yields move up, gold often slips. Why? Because investors can get better returns from assets that do pay income, such as Treasury bonds.
Is gold still a good inflation hedge in every cycle?
No. Gold is not a reliable inflation hedge in every market cycle.
It can help preserve purchasing power over long stretches of time, which is why many people still see it as a store of value. But over shorter inflation spikes, the picture gets messy. Its performance is mixed, not steady.
What tends to matter most is real interest rates. Gold often performs best when real rates are low or negative. When real rates move up, gold can lose ground even if inflation is still high. That’s exactly what happened from 1980 to 1984, when gold fell despite high inflation.
What signals could show the next gold regime shift?
Watch real interest rates, central bank policy, institutional gold buying, geopolitical instability, and the U.S. dollar.
Gold often does better when real rates fall. It also tends to move in the opposite direction of the dollar, which is why the U.S. dollar matters so much here.
On the chart side, tools like moving-average crossovers, RSI trends, and Fibonacci-based price levels can help you see whether those shifts in the background are starting to show up as a new trend in price.