Gold did not move at random in this 12-month stretch. From July 2025 to July 2026, I can group the action into four clear phases: late-year gains, strong January-February upside, a March-May slide, and weak June-July follow-through.
If you want the short version, here it is:
- Best stretch: August 2025 through February 2026, with a seven-month winning run
- Peak: $5,030.00/oz in February 2026
- Weak stretch: March through July 2026, including a -7.73% drop in June
- 12-month average price: $4,249.47/oz
- Year-over-year move: +23.55% as of 07/14/2026
This matters if you track gold month by month. I’d use these patterns as a timing filter, not a prediction tool. The article’s main point is simple: check average return, win rate, volatility, and repeat rate together, then test the pattern with historical API data instead of trusting a one-year chart.
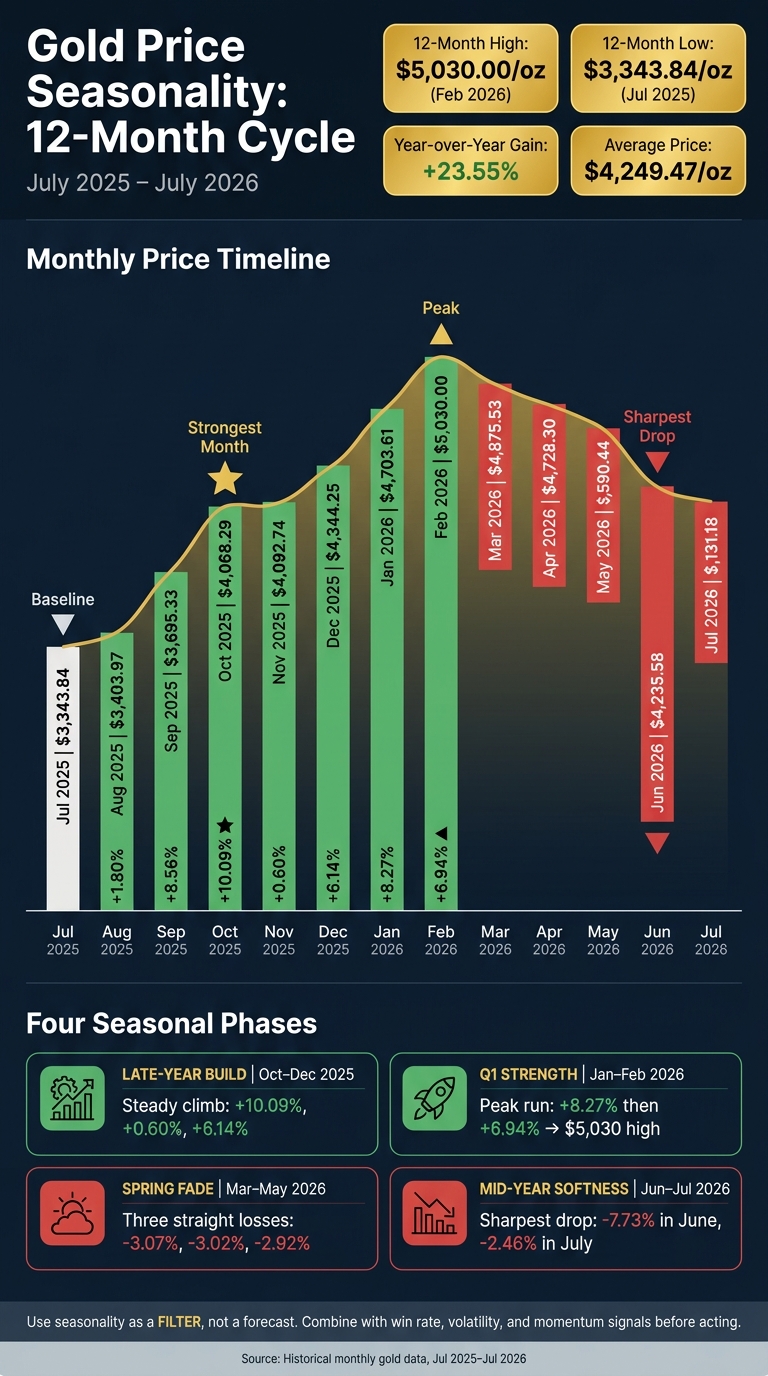
Gold Price Seasonality: 12-Month Cycle Jul 2025–Jul 2026
Gold Seasonality: The Pattern that Reveals the Best Time to Buy Gold
sbb-itb-a92d0a3
Quick Comparison
| Period | What I see | Key detail |
|---|---|---|
| Aug-Feb | Strong upside | Rally from $3,343.84 to $5,030.00 |
| Mar-May | Spring drop | Three straight monthly losses |
| Jun-Jul | Mid-year weakness | June had the sharpest fall at -7.73% |
| Late 2025 | Year-end build | September, October, and December were strong |
| How to test it | Use monthly historical data | Group returns by month and compare mean, median, and win rate |
In other words: the article shows that gold had a clear seasonal rhythm in this period, but I would treat that rhythm as context, not a stand-alone signal.
1. January
January was one of gold's strongest months in the latest cycle. The price climbed from $4,344.25 in December 2025 to $4,703.61 in January 2026, which works out to an 8.27% gain. Over the trailing 12 months, only October 2025 (+10.1%) and September 2025 (+8.5%) did better.
Pattern Persistence
January also stretched the rally to seven straight months, running from July 2025 through January 2026.
Subsequent Months
The move didn't stop right away. Gold hit a peak of $5,030.00 in February 2026, then turned lower and fell for four straight months through June.
That January push carried into February's peak before the spring pullback started.
2. February
February 2026 marked the high point of the 12-month period. Gold climbed to $5,030.00 per troy ounce, the top level seen from July 2025 through July 2026.
Average Return
Gold gained 6.94% in February compared with January’s close of $4,703.61. That was still lower than January’s 8.27% rise.
Pattern Persistence
The February peak didn’t last. In March 2026, gold dropped to $4,875.53, a -3.07% monthly move, and the slide continued in the months that followed. March reversed the rally.
After the Peak
After February, the rally started to lose steam, though the broader uptrend was still in place.
March’s drop was the first clear sign of a reversal.
3. March
March 2026 came right after February’s 12-month high of $5,030.00. From there, gold eased to $4,875.53, a drop of $154.47, or 3.07%, from February. That move kicked off the spring slide.
March often acts like a turning point in gold’s seasonal pattern, and 2026 fit that pattern.
Monthly Return
March delivered the first monthly loss of 2026. After two strong months, the first quarter hit its high point in February.
Pattern Persistence
The drop carried on into April and May.
Even with that pullback, March still sat 14.7% above the 12-month average of $4,249.47. April then made it clear that this wasn’t a one-month blip.
| Month | Gold Price (USD per troy ounce) | Monthly Return (%) |
|---|---|---|
| January 2026 | $4,703.61 | +8.27% |
| February 2026 | $5,030.00 | +6.94% |
| March 2026 | $4,875.53 | -3.07% |
Source: Historical monthly data, July 2025–July 2026.
4. April
April 2026 kept the slide going. Gold moved from $4,875.53 in March to $4,728.30 in April, which worked out to a 3.02% decline.
Monthly Return
Even with that drop, April still came in about 11.4% above the 12-month average of $4,249.47.
Pattern Persistence
April was part of a three-month pullback. The sequence was pretty clear: March -3.07%, April -3.02%, and May -2.92%.
| Month | Gold Price (USD per troy ounce) | Monthly Return (%) |
|---|---|---|
| February 2026 | $5,030.00 | +6.94% |
| March 2026 | $4,875.53 | -3.07% |
| April 2026 | $4,728.30 | -3.02% |
| May 2026 | $4,590.44 | -2.92% |
Source: Historical monthly data.
Gold was still up 23.55% year over year, so April’s drop happened within a broader uptrend. May then pushed the decline further. For broader context on how these shifts compare to other markets, see our commodity market analysis.
5. May
May kept April’s pullback going, so gold stayed in the cooler stretch that started after February. The price fell to $4,590.44 per troy ounce, a 2.92% drop from April’s $4,728.30. That left gold under pressure going into June.
Average Return
May’s 2.92% decline came in below the year’s average monthly return of about 1.96%. Even so, gold was still trading 8.02% above the 12-month mean of $4,249.47.
Pattern Persistence
From March through May, gold logged three straight monthly losses. Then June made the move sharper, with the price dropping to $4,235.58, down 7.73%.
| Month | Gold Price (USD/oz) | Monthly Return (%) |
|---|---|---|
| March 2026 | $4,875.53 | -3.07% |
| April 2026 | $4,728.30 | -3.02% |
| May 2026 | $4,590.44 | -2.92% |
| June 2026 | $4,235.58 | -7.73% |
Source: Historical monthly data.
June pushed the correction lower. This trend mirrors volatility often seen in other energy markets, such as natural gas price fluctuations.
6. June
June saw the biggest monthly drop in this run. Gold fell 7.73%, sliding from $4,590.44 to $4,235.58. That was almost three times steeper than May’s 2.92% decline.
Relative to the 12-Month Average
June closed 0.33% below the 12-month average of $4,249.47.
Pattern Persistence
June also marked the fourth straight monthly decline since the peak in February.
| Month | Gold Price (USD/oz) | Monthly Return (%) |
|---|---|---|
| February 2026 | $5,030.00 | +6.94% |
| March 2026 | $4,875.53 | -3.07% |
| April 2026 | $4,728.30 | -3.02% |
| May 2026 | $4,590.44 | -2.92% |
| June 2026 | $4,235.58 | -7.73% |
Source: Historical monthly data.
7. July
After June’s 7.73% slide, gold fell another 2.46% in July 2026, moving from $4,235.58 to $4,131.18. That means July kept the post-February pullback going, though the drop wasn’t as steep as June’s.
Average Return
July’s closing price came in about $118 below the 12-month average of $4,249.47. Even so, gold was still 23.55% above its level from July 2025, when it hit the 12-month low of $3,343.84.
Pattern Persistence
July also kept the four-month losing streak in place after February’s peak. From March through July, gold posted a loss each month as it drifted down from the $5,030.00 high.
| Month | Gold Price (USD per troy ounce) | Monthly Return (%) |
|---|---|---|
| June 2026 | $4,235.58 | -7.73% |
| July 2026 | $4,131.18 | -2.46% |
Source: Historical monthly data.
8. August
After July’s pullback, August 2025 was the first clear bounce. Gold moved from $3,343.84 to $3,403.97 per troy ounce, a gain of 1.80%.
This was the month when the slide flipped into a rally.
Pattern Persistence
That move kicked off a seven-month winning streak that ran through February 2026. From the low to the peak, gold added about $1,686 per troy ounce.
August also lines up with the start of the autumn-to-winter strength window. In longer lookbacks, this shows up as a repeatable multi-month climb that’s worth watching.
If you want to test the same setup yourself, you can use OilpriceAPI’s /v1/prices/historical endpoint with monthly gold data.
September then pushed that rebound into a sharper rally.
9. September
September 2025 picked up right where August left off. After August closed at $3,403.97, September climbed to $3,695.33. That was an 8.56% gain, or $291.36, which made September the second-strongest month in the cycle, behind only October 2025.
The move also helped keep the rally alive into the next month. October didn’t just follow September’s lead - it went on to become the strongest month in the cycle.
Average Return
September’s 8.56% return ranked just behind October 2025’s 10.09% gain. In plain terms, September was one of the cycle’s best months, and October pushed the move even further.
Pattern Persistence
September continued the rebound that started in August and helped set the stage for October’s stronger advance.
10. October
October 2025 was the strongest month in this cycle. Gold climbed from $3,695.33 in September to $4,068.29 in October, up $372.96, or 10.09%. That move also built on the late-year momentum that had already started to show in September.
Monthly Return
October’s 10.09% monthly return came in just above September’s 8.56% gain.
That said, the pace cooled right after. November 2025 posted a gain of just 0.60%, closing at $4,092.74. Even so, the bigger trend stayed in place into early 2026, and gold later reached $5,030.00 in February 2026.
| Month | Closing Price | Monthly Return |
|---|---|---|
| September 2025 | $3,695.33 | +8.56% |
| October 2025 | $4,068.29 | +10.09% |
| November 2025 | $4,092.74 | +0.60% |
November then showed that October’s pace was hard to keep up.
11. November
November 2025 was much quieter.
After October’s 10.09% rally, gold cooled off and closed November at $4,092.74. That was $24.45 above October’s $4,068.29 close, for a monthly return of +0.60%. It was the smallest monthly gain in the August 2025–February 2026 run. In that sense, November sat between October’s sharp jump and December’s bounce.
Monthly Return
November’s +0.60% return looks small next to October’s 10.09% gain and December’s +6.15% move to $4,344.25.
Volatility
November also had the lowest relative volatility in the fourth quarter of 2025. Gold added just $24.45 from October’s close, far less than the $372.96 move in October and the $251.51 move in December.
This reads like a pause. Prices held up, but the market didn’t push much higher until the stronger December and January stretch. That setup helps explain December’s bigger move.
Pattern Persistence
Even with the smaller gain, November still finished higher. It also stayed part of a seven-month winning streak that started in August 2025 at $3,403.97 and continued through February 2026, when gold reached $5,030.00.
| Month | Closing Price | Monthly Return |
|---|---|---|
| October 2025 | $4,068.29 | +10.09% |
| November 2025 | $4,092.74 | +0.60% |
| December 2025 | $4,344.25 | +6.15% |
12. December
December pushed gold's year-end run even higher, adding to the late-year momentum already seen in September, October, and November. Gold closed at $4,344.25, up $251.51 from November's $4,092.74, which worked out to a monthly return of +6.14%. That put December in the fifth spot among the strongest months in the window.
The move also kicked off a three-month climb that carried into $4,703.61 in January 2026 and $5,030.00 in February 2026.
| Month | Gold Price (USD per troy ounce) | Monthly Return |
|---|---|---|
| November 2025 | $4,092.74 | +0.60% |
| December 2025 | $4,344.25 | +6.14% |
| January 2026 | $4,703.61 | +8.27% |
Source: Historical monthly gold data.
For analysts, this kind of year-end push is one of the monthly patterns worth checking with historical API data.
What Monthly Gold Patterns Tell Analysts and Developers
Those month-by-month moves boil down to a few seasonal groups that show up again and again. Across the full July 2025–July 2026 window, gold shows four usable patterns: Q1 strength, a spring fade, mid-year softness, and a late-year build.
| Seasonal Cluster | Months | Behavior |
|---|---|---|
| Q1 Strength | January, February | Peak returns |
| Spring Fade | March, April, May | Losses from March through May |
| Mid-Year Softness | June, July | Continued decline |
| Late-Year Build | October, November, December | Steady late-year climb |
Mean return can point you in the wrong direction if a few outlier months skew the data. That’s why median return, win rate, and volatility give a better read on whether a pattern has some staying power. Rolling windows help check if those clusters keep showing up over time or if they fade once you zoom in.
To test those clusters, pull historical price data and compare month-end returns across rolling windows or analyze commodity trends with AI. Call GET /v1/prices/historical with by_code=GOLD_USD and interval=daily to get historical gold prices, then load the JSON into a Pandas DataFrame. From there, resample to month-end closes, calculate month-over-month returns with .pct_change(), and apply a 120-month rolling mean for 10-year lookbacks.
Next, group returns by df.index.month and compare mean versus median returns to see which clusters hold up and which ones are just noise.
Pros and Cons of Monthly Gold Seasonality Analysis
After mapping the monthly clusters, the next step is figuring out how much they help in the real world. Monthly gold seasonality works best as a benchmark, not a forecast. Put simply, it gives you a reference point. It does not tell you where gold will go next.
The biggest weakness is sample size. Each month gives you just one data point per year, so even a 10-year study leaves you with only 10 observations for that month. That makes the average easy to skew. One odd year, or even a short period of market stress, can throw things off.
Macro forces can also drown out seasonal patterns. Policy changes, interest rate moves, and U.S. dollar strength often matter more than the calendar. Gold usually moves opposite the U.S. dollar, but that relationship can loosen during crises.
That’s why these patterns make more sense when you turn them into actual analysis or trading use cases instead of treating them like a stand-alone signal.
| Use Case | Benefits | Risks | Best Interpretation |
|---|---|---|---|
| Benchmarking and Expectations | Provides a mean price baseline and uses Z-scores and percentiles to define normal versus extreme monthly price levels | High year-over-year volatility can make the average feel stale; small per-month sample sizes can lead to false conclusions | Use as a relative gauge of value and check seasonal expectations against RSI and other momentum signals |
| Timing and Risk Planning | Highlights months with higher past volatility or stronger demand; points to windows where entries and exits have often looked stronger | Leaning too hard on calendar dates can make you miss non-seasonal breakouts; macro shocks can override seasonal demand in any month | Set stop-loss distance with past monthly volatility percentages; pair seasonal windows with RSI and support/resistance levels |
The practical way to use monthly seasonality is simple: treat it as a filter, not a trade trigger. A Z-score below -2.0 suggests the month-end price is unusually low, while a Z-score above +2.0 suggests it is significantly overvalued.
Then bring in RSI. If RSI is above 70 during a month that is usually strong for gold, the move may already be stretched too far. In that setup, seasonality helps narrow the time window, while momentum and valuation signals help you judge whether the move still has room left.
Conclusion
Looking across the full calendar, the market tends to fall into a few clear seasonal phases. In the latest 12-month cycle, gold peaked in February 2026, then slipped into a spring-summer correction. Late 2025, by contrast, showed a steady year-end build.
To tell whether a monthly pattern has some staying power or was just a one-off, use average return, win rate, volatility, and persistence together. One number alone rarely tells the whole story.
These patterns are also simple to test at scale with historical API data. Analysts and developers can use OilpriceAPI's GET /v1/prices/historical endpoint, then group the data by month. GET /v1/analytics/statistics adds Z-scores and percentiles, which helps show whether current prices sit above or below seasonal norms.
Treat monthly seasonality as a filter, not a forecast. It can narrow the window, but price, volatility, and momentum still decide the trade.
FAQs
How reliable is one year of gold seasonality data?
One year of gold seasonality data usually isn’t enough to spot patterns you can trust. It gives you only a single snapshot of price action, and that snapshot can be thrown off by short-term volatility or one-off economic events.
That’s why analysts usually look at data across multiple years. It helps separate recurring seasonal trends from plain market noise. With OilpriceAPI, you can pull historical data, backtest those patterns over several years, and see if they hold up over time.
Which metrics matter most when testing monthly gold patterns?
Focus on monthly averages to spot recurring cycles and annualized volatility to judge how steady those patterns tend to be.
You can also use z-scores and percentile rankings to check whether a month’s move looks out of the ordinary. Then layer in RSI and moving averages to confirm trend strength and flag overbought or oversold conditions.
OilpriceAPI provides the historical data needed to run these calculations.
How can I test gold seasonality with API data?
Use OilpriceAPI’s historical prices endpoint to pull multi-year gold time-series data, then group prices by month to spot repeating seasonal patterns.
In Python, turn the JSON response into a pandas DataFrame, pull the month from each date, and compute average prices for each month. That gives you a simple way to see whether gold tends to behave a certain way in January, February, and so on.
Here’s the basic flow:
- Request multi-year historical gold data from OilpriceAPI
- Load the response into pandas
- Convert the date field to
datetime - Extract the month number or month name
- Group by month and calculate the mean price
- Add trend or momentum indicators to back up what the seasonal pattern is telling you
A simple example looks like this:
import requests
import pandas as pd

url = "https://api.oilpriceapi.com/v1/prices/historical"
headers = {
    "Authorization": "Token YOUR_API_KEY"
}
params = {
    "symbol": "XAUUSD",
    "start_date": "2020-01-01",
    "end_date": "2024-12-31"
}

response = requests.get(url, headers=headers, params=params)
data = response.json()

df = pd.DataFrame(data["data"])
df["date"] = pd.to_datetime(df["date"])
df["price"] = pd.to_numeric(df["price"])
df["month"] = df["date"].dt.month
df["month_name"] = df["date"].dt.strftime("%b")

monthly_avg = (
    df.groupby(["month", "month_name"])["price"]
    .mean()
    .reset_index()
    .sort_values("month")
)

print(monthly_avg)
If you want a cleaner view, map those averages into a chart. That usually makes the seasonal pattern easier to read than a plain table.
You can also layer in a few supporting metrics. For example, a rolling moving average can help separate the long-term drift from the month-by-month pattern. Rate of change or momentum can show whether gold tends to enter certain months with strength or weakness.
df = df.sort_values("date")
df["ma_50"] = df["price"].rolling(50).mean()
df["momentum_20"] = df["price"] - df["price"].shift(20)
df["roc_20"] = df["price"].pct_change(20) * 100
That extra context matters. A month may show a high average price, but if momentum is fading at the same time, the setup may not be as strong as it looks at first glance.
You can also compare monthly averages against each year’s monthly returns instead of raw prices. That helps when the market has a strong long-run uptrend, because absolute price levels from one year to another can skew the picture.
df["year"] = df["date"].dt.year
df["monthly_return"] = df["price"].pct_change()

seasonal_returns = (
    df.groupby("month")["monthly_return"]
    .mean()
    .reset_index()
)
If your dataset is large, it’s worth checking for missing dates, duplicate rows, or gaps around market holidays before you group anything. Small data issues can throw off monthly averages more than people expect.