Most backtests go wrong before the strategy even starts. If I want results I can trust, I need to lock down one oil benchmark, one time interval, and one fixed dataset before I test anything.
Here’s the short version:
- I pick WTI or Brent and do not mix them.
- I match data frequency to the strategy:
- Daily for swing systems
- Hourly for intraday setups
- Minute data only when entry timing changes results
- I keep the right fields:
datecloseorpriceopen,high,lowif my rules use bar datavolume,contract, and price type for futures work
- I check for common data problems:
- missing market days
- duplicate timestamps
- roll gaps
- mixed adjusted and unadjusted rows
- timezone mismatches
- I pull the series with OilPriceAPI using:
Authorization: Token YOUR_API_KEY- the historical endpoint
- fixed date ranges and intervals
- I store the cleaned output in a locked schema so I can rerun the same test later
A daily system usually works with about 260 trading days per year, while intraday systems need far more rows and more cleanup. And if a futures series rolls the wrong way, one bad splice can distort signals, returns, and drawdowns.
Quick Comparison
| Choice | Best For | Main Risk |
|---|---|---|
| Daily data | Swing and trend systems | No intraday fill testing |
| Hourly data | Intraday systems | More storage and processing |
| Minute data | Timing-sensitive entries and exits | High noise |
| Contract-based series | Futures tests with exact delivery months | I must handle rolls myself |
| Continuous series | Long-range chart and trend testing | Stitch method can change results |
So the process is simple: define the series, clean the data, fetch it the same way each time, and save a fixed copy before backtesting.
sbb-itb-a92d0a3
Choose the Right Oil Series and Granularity
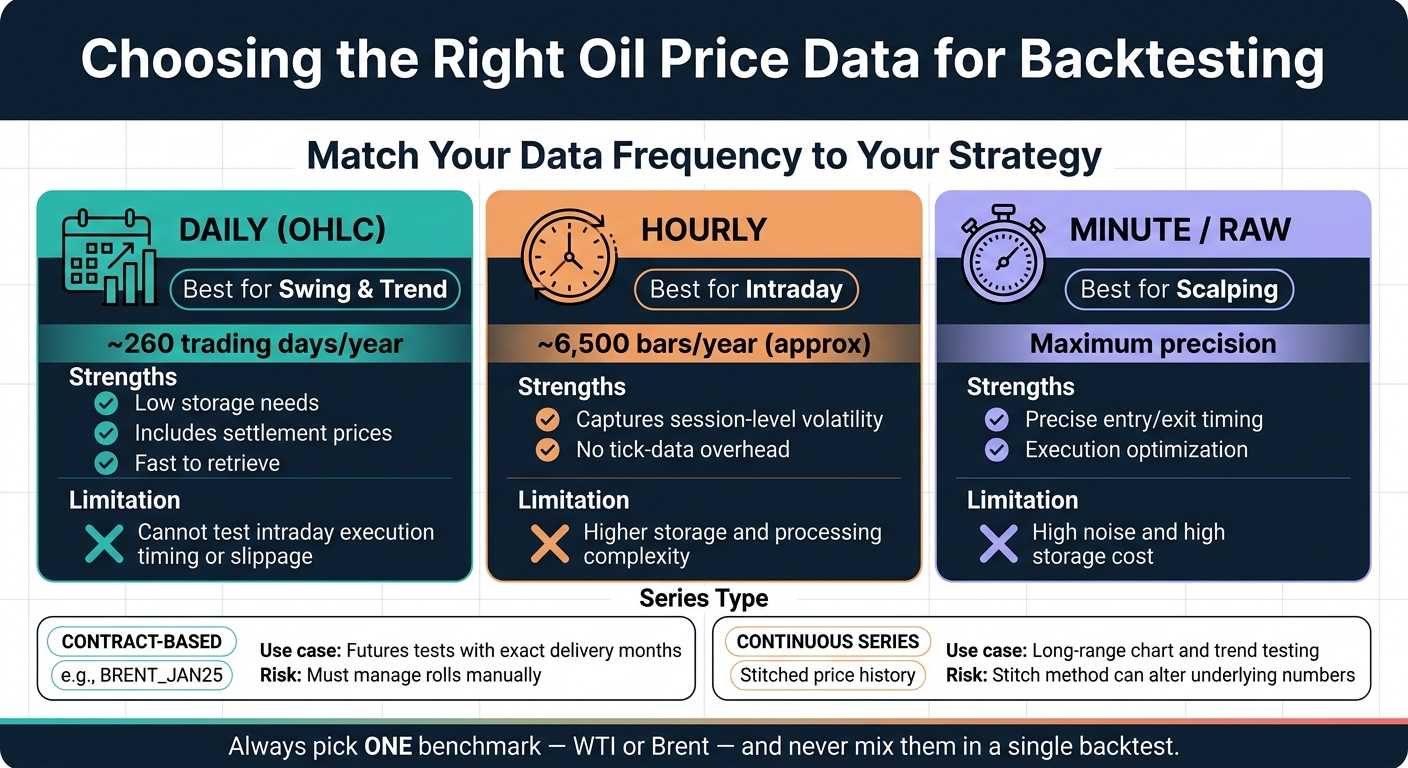
Oil Price Data Types for Backtesting: Daily vs Hourly vs Minute
Once the core fields are in place, the next step is to choose the exact series definition and bar size.
Use One Consistent Benchmark and Series Definition
Pick one benchmark and stick with it for the entire series. WTI and Brent track different markets, so mixing them in one backtest will skew the result. Keep the currency, units, and timezone the same from start to finish.
Then decide what kind of history you need: contract-level data or a stitched series.
Understand Continuous vs. Contract-Based Data
Oil futures data usually comes in two very different forms. If you blur the line between them, errors can slip in without much warning.
Contract-based data links each price to one delivery month, like BRENT_JAN25. That gives you precision. But it also means you have to manage rolls yourself. When one contract expires, you need a clear rule for moving into the next one. If that rule isn't defined, expiration gaps can bend your backtest out of shape.
Continuous series do that roll work for you. They combine contracts into one uninterrupted price history. That's handy for long-range trend work, but the stitching method still matters. A continuous chart may look smooth, yet the way it was stitched can change the numbers underneath.
Before building anything on top of a series, check what it actually is. Review the contract identifier and roll method in the series metadata. Spot prices show the current physical market. Continuous series are synthetic constructs. Neither is wrong, but they answer different questions. Mix them in one backtest, and both become useless. That choice affects how you deal with rolls, gaps, and settlement continuity.
Compare Daily, Hourly, and Minute Data Before You Build
Match the bar size to your execution rules, not just to what happens to be easy to download.
| Data Frequency | Strategy Type | Strengths | Limitations |
|---|---|---|---|
| Daily (OHLC) | Swing trading, trend following | Low storage needs; includes settlement prices; fast to retrieve | Cannot test intraday execution timing or slippage |
| Hourly | Intraday mean reversion, day trading | Captures session-level volatility without tick-data overhead | Higher storage and processing complexity than daily |
| Minute / Raw | Scalping, execution optimization | Maximum precision for entry/exit timing | High noise and storage cost |
A simple rule works well here:
- Start with daily OHLC unless your rules depend on intraday timing.
- Use hourly data for intraday systems.
- Save minute-level data for cases where entry and exit timing directly affect results.
Clean the Data Before You Trust the Backtest
Once you choose the series, check it before you run a backtest. Bad data can wreck a good strategy fast. Gaps, duplicates, and mixed adjustments can make a solid idea look great on paper when it actually isn't.
Check for Survivorship, Roll, and Adjustment Bias
A lot of backtest mistakes don't come from the strategy itself. They come from hidden assumptions in the data.
Survivorship bias shows up when expired contracts, delisted rows, or missing observations are left out of the series. That can make volatility look lower than it was and shrink drawdowns on paper.
Roll bias is harder to spot. Make sure the roll method is documented and used the same way across the full series.
Adjustment bias happens when adjusted and unadjusted rows are mixed together in one dataset. That's a recipe for bad signals and bad P&L math.
Run Basic Sanity Checks on Every Historical Series
After the bias checks, run a few simple validations on every file. Start by sorting the data by timestamp. Then compare it with the exchange calendar to spot missing trading days. If the market was open and your series has a gap, volatility will look lower than it should, and your time series won't line up cleanly.
A few checks belong on every pass:
- Duplicate timestamps: Run a uniqueness check. If duplicates show up, keep only the latest source-backed row.
- Timezone consistency: Use ISO 8601 timestamps in UTC, like
2026-01-01T00:00:00Z. If you mix local session times with UTC, signals and fills won't line up. - Price formatting: Make sure all values are in USD and use standard decimal formatting, such as
83.25. Comma decimals or mixed currencies will corrupt return calculations. - Outlier flags: Any price that jumps far away from nearby observations needs a manual review. It might be a real market event. It might also be a plain data mistake.
- Data freshness: Compare the latest source timestamp with the expected update cadence.
Log Data Issues and Fixes
Write down every issue you find and every fix you make. That's what makes the backtest reproducible. If you rerun the same strategy six months later and the results change, the issue log helps you see whether the data changed or the strategy did.
| Data Problem | Bias/Impact on Backtest | Remediation Step |
|---|---|---|
| Missing market days | Underestimates volatility; breaks time-series continuity | Compare the series against an exchange calendar; interpolate or flag gaps as non-trading days |
| Duplicate timestamps | Overweights specific observations; distorts moving averages | Run a uniqueness check; keep only the latest source-backed row |
| Roll gaps | Creates artificial P&L spikes at contract expiry | Use contract_month metadata to document and apply price adjustments |
| Stale data | Trades on outdated prices; introduces lag or look-ahead bias | Compare the latest source timestamp to the expected update cadence |
| Negative or zero prices | Break log returns | Use linear returns or explicitly handle non-positive values |
| Timezone mismatch | Misaligns signals with execution fills | Standardize all inputs to UTC using ISO 8601 format |
Use this checklist before you store the series for backtesting.
Retrieve Historical Oil Prices with OilPriceAPI
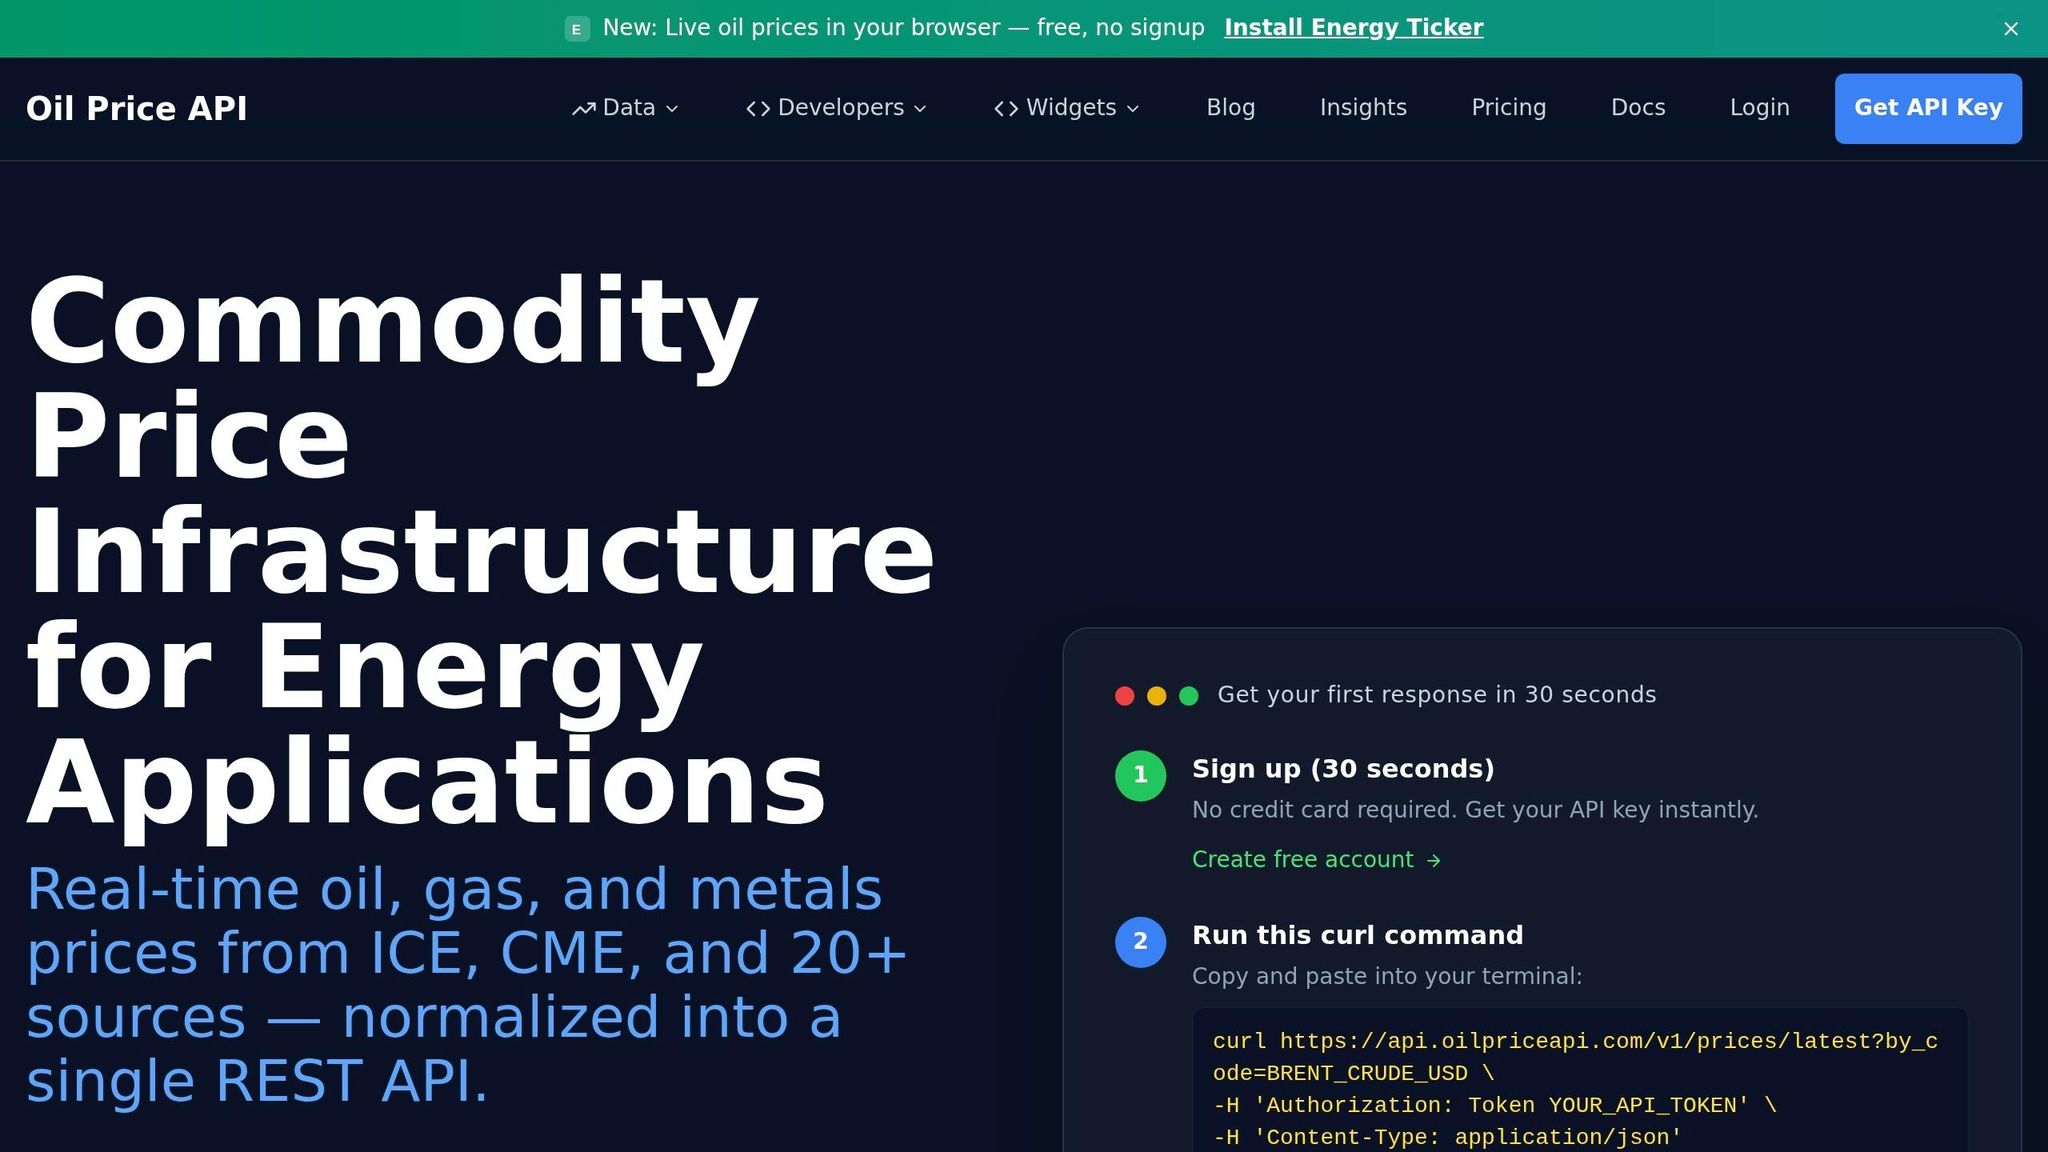
After validation, pull the same benchmark and interval into your backtest from OilPriceAPI. OilPriceAPI is a REST API that returns historical oil price data in JSON.
Start with the API Authentication Pattern
Every request needs a token-based header:
Authorization: Token YOUR_API_KEY
Use "Token" - not "Bearer". If you use the wrong prefix, the API will return a 401 Unauthorized error.
Before you pull historical data, test your key with a GET request to the latest prices endpoint:
GET https://api.oilpriceapi.com/v1/prices/latest
For repeatable backtests, pull the exact historical series you plan to store and rerun. For historical data, use GET https://api.oilpriceapi.com/v1/prices/historical. It supports by_code, start_date, end_date, and interval for daily, weekly, or monthly series. For the full reference, see the official API documentation.
Pick the Right Integration Path for Your Workflow
Use Excel or Google Sheets for quick checks. Use Python or Node.js when you want a backtest pipeline you can run again without extra manual work.
The Excel guide and Google Sheets guide walk through the spreadsheet route. The Python tutorial and Node.js tutorial show how authentication and request handling work in each setup.
Use those guides to plug the fetch step into a backtest process you can rerun. Once that step is set, store the series in a fixed schema for repeatable runs.
Structure the Dataset for Reproducible Backtests
Once you've fetched and checked the series, the next step is simple: put it into a stable table before you run any backtests.
If you skip this part, things get messy fast. A small field-name change, a missing contract code, or a timestamp mismatch can throw off your results.
Define a Clear Schema and Storage Format
Convert the JSON response to CSV so it's easy to work with in Python, Node.js, and spreadsheets.
Each record in the dataset should include these fields:
| Field | Purpose | Format |
|---|---|---|
date |
Primary time index | ISO 8601 date (YYYY-MM-DD) |
benchmark |
Oil series identifier | e.g., WTI_USD, BRENT_CRUDE_USD |
price |
Numerical price value | Float, USD (e.g., 75.42) |
currency |
Price denomination | Standardized to USD |
unit |
Unit of measure | e.g., barrel |
type |
Data category | e.g., spot_price, futures |
contract |
Futures delivery month | e.g., BRENT_JAN25 |
source |
Source identifier | e.g., your feed or provider code |
That schema gives you one clean shape for every row. It also makes joins, filters, and reruns much less of a headache.
Store timestamps in UTC using ISO 8601, such as 2026-01-01T00:00:00Z, to avoid daylight saving shifts.
Once the schema is set, freeze each cleaned snapshot under the same field names.
Version the Series So Results Stay Reproducible
Save one cleaned snapshot for each test run. That way, if results change later, you can tell whether the cause was strategy logic or updated data.
For futures strategies, store the contract identifier with each record.
Conclusion: Build on Clean, Documented Historical Oil Data
A reliable backtest starts with one benchmark, one interval, clean data, and a frozen dataset for each run. OilPriceAPI provides historical WTI, Brent, and other commodity series that you can normalize and store for repeatable tests.
Get a free API key at OilPriceAPI and start pulling the exact series your backtest needs.
FAQs
How much historical oil data do I need for a reliable backtest?
It depends on your trading strategy. There isn't one fixed rule.
Use daily data for short-term strategies. Use monthly data for long-term trend models.
For a backtest you can trust more, run it across different market conditions, such as:
- bull runs
- crashes
- range-bound periods
Historical data going back to 2014 can help you check performance across those market cycles.
Should I backtest with spot prices, continuous futures, or contract-level data?
It depends on your strategy.
Spot prices are best for general market analysis. Continuous futures are often used for long-term trend modeling. And contract-level data is a must for backtesting futures spreads and technical strategies where the contract month, expiry, or market maturity can change the outcome.
For technical analysis and algorithm development, use OHLC data.
And when you compare results, check the contract month or reference type every time. Otherwise, it’s easy to mix spot prices with futures settlement values, and that can throw off your analysis fast.
How do I handle futures rolls without distorting strategy results?
Maintain the contract-month context instead of leaning on continuous-series assumptions. Use historical futures endpoints that keep the metadata for each contract month intact, and check both the contract-month field and front-month status so you're comparing like-for-like instruments.
Also, don’t mix spot benchmark data with futures settlement values. That can create artificial price gaps, especially during roll periods.