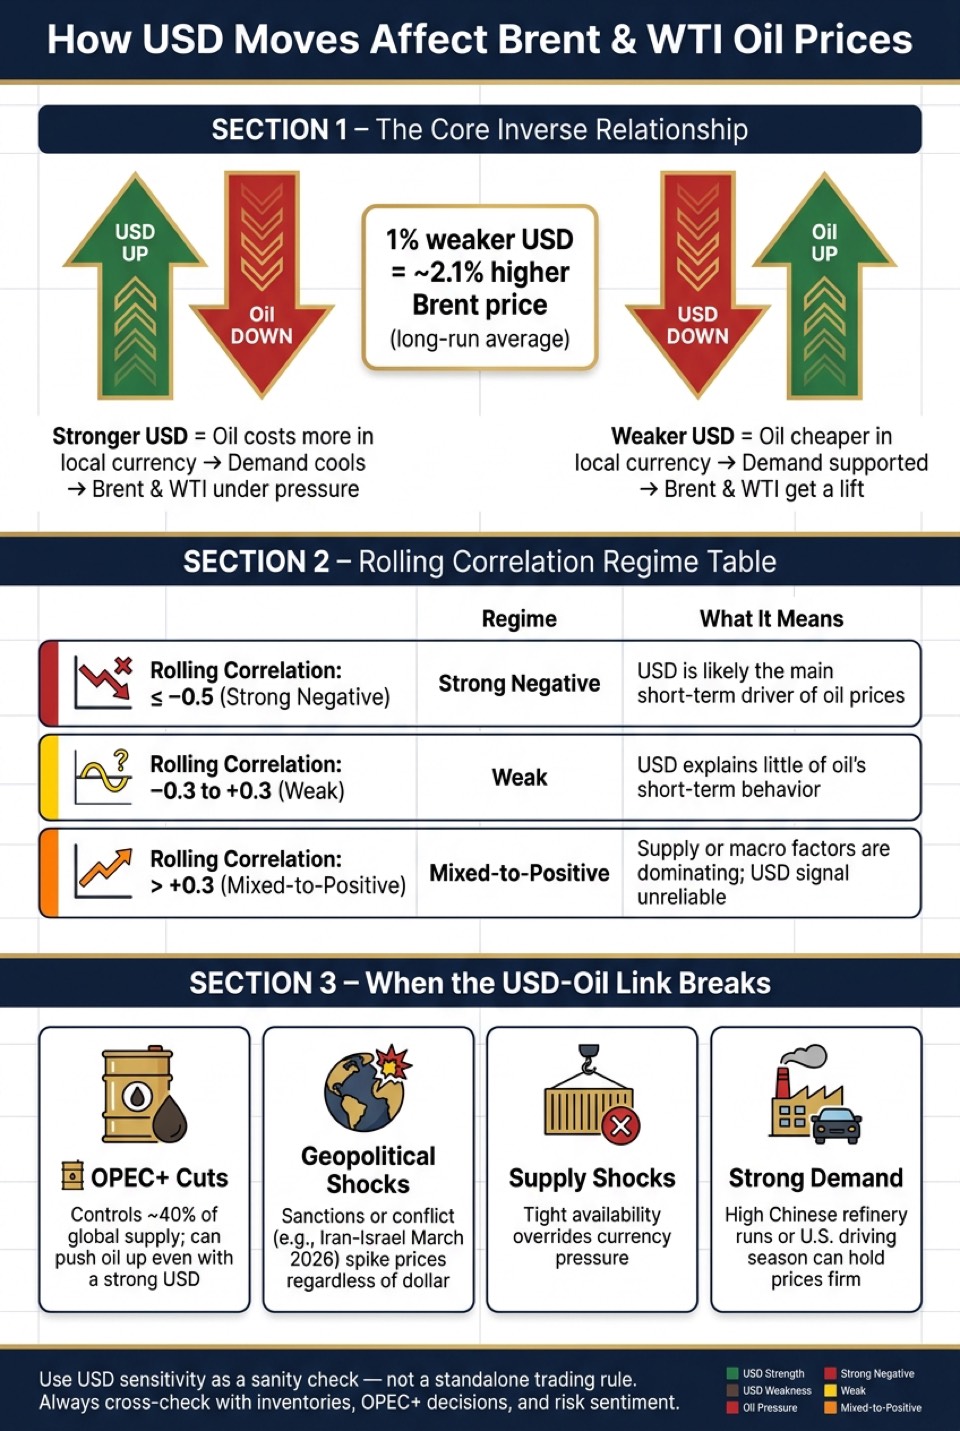
If the U.S. dollar goes up, Brent and WTI often come under pressure. If the dollar falls, oil often gets support. That’s the core idea. Because oil is priced in U.S. dollars, buyers outside the U.S. feel currency moves right away.
Here’s the short version:
- Stronger USD: oil costs more in local currency for non-U.S. buyers, which can cool demand
- Weaker USD: oil gets cheaper in local currency terms, which can help demand
- The link is not fixed: global oil market factors like supply shocks, OPEC+ cuts, sanctions, and inventories can override FX moves
- A useful workflow is simple: pull Brent, WTI, and USD data, convert prices into daily returns, and track 20-day and 60-day rolling correlation
- A common read:
- ≤ -0.5: USD is likely a main short-term driver
- -0.3 to +0.3: the link is weak
- > +0.3: oil and USD may be moving together because other forces are in control
One figure from the article stands out: a 1% weaker dollar has been linked on average with a 2.1% higher Brent price in one long-run sample. But that does not mean the dollar tells the whole story on every trading day.
USD vs. Oil Prices: How Dollar Moves Drive Brent & WTI
Why Oil and the Dollar Are Moving Together | Presented by CME Group

sbb-itb-a92d0a3
Quick Comparison
| Situation | What often happens to oil | What I’d check next |
|---|---|---|
| USD rises, supply is calm | Brent and WTI may drift lower | DXY, EUR/USD, daily returns |
| USD falls, supply is calm | Brent and WTI may firm up | Demand data, refinery activity |
| USD rises, oil also rises | FX link may be weak | OPEC+, sanctions, war risk |
| USD falls, oil still drops | FX is likely not the main driver | Inventories, growth fears, risk-off flows |
| Brent and WTI split apart | Local oil market factors matter more | Cushing, spreads, seaborne supply |
My takeaway: use USD sensitivity as a check, not a stand-alone rule. If you line up the data, measure returns instead of raw prices, and screen for event risk, you get a much cleaner read on whether the dollar is pushing crude - or whether oil market news is doing the work.
How the USD Affects Brent and WTI Prices
The Pricing Channel and the Non-U.S. Buyer Effect
Brent and WTI are priced in U.S. dollars. So when the USD moves, the cost of oil changes for buyers outside the United States.
Here’s the simple version: if Brent is $78.40 and the USD climbs 5% against the euro, a European refiner will pay about 5% more in euros for that same barrel. Same oil, same dollar price, but a higher local-currency bill.
That matters because a stronger dollar can chip away at foreign demand. And when demand softens at the margin, Brent and WTI can come under pressure. On the flip side, when the dollar slips, oil becomes less expensive in local currencies, which can help consumption and support dollar-priced crude.
By itself, though, that signal only gets useful when you compare it with live Brent, WTI, and FX data.
When the Inverse Relationship Weakens or Reverses
The usual USD-oil inverse pattern doesn’t always hold. At times, other forces take over and matter more than currency moves.
A supply shock is the clearest example. If crude availability tightens, prices can move up even while the dollar is climbing. The same thing can happen when demand jumps hard enough to outweigh FX pressure.
A few drivers tend to break the pattern:
- OPEC+ production cuts: The group controls about 40% of global supply. When it keeps output tight, prices can move higher even if the USD is firm.
- Sanctions and geopolitical risk: Limits on Russian or Iranian crude can shrink effective supply and add a risk premium. In March 2026, the Iran-Israel conflict set off fast crude price spikes that broke the usual USD-oil pattern.
- Strong demand shocks: Higher Chinese refinery runs or a tight U.S. summer driving season can keep prices elevated even with a stronger dollar.
Recent research points to the same idea: the USD-oil link is not fixed. It can weaken, or even reverse, when other shocks take control.
| Market Condition | Typical Oil Reaction |
|---|---|
| USD rally, stable supply | Brent/WTI often face downward pressure |
| USD pullback, stable supply | Brent/WTI often get support |
| OPEC+ production cut | Oil can rise despite a stronger USD |
| Sanctions on major exporters | Oil may rally regardless of USD direction |
| Strong global demand | Oil may hold firm or rise despite the dollar |
To track that shift as it happens, it helps to watch a small set of core USD and oil data series.
Which USD and Oil Indicators to Track
Track a small, steady set of daily series.
Core Data Series: Brent, WTI, and Broad USD Measures
Start with front-month Brent, front-month WTI, and a broad USD measure on the same time frame. Daily closes are a good fit for swing traders and macro analysts. Hourly bars help when you want to check intraday correlation.
For crude, use settlement or last prices quoted in USD per barrel. For example, Brent at $83.45 and WTI at $79.10 on 07/15/2026. For the dollar, begin with the U.S. Dollar Index (DXY). It’s liquid, heavily watched, and tracks USD moves against a basket of major currencies. If you need a broader macro view, use the Federal Reserve trade-weighted USD index instead of relying on DXY alone.
Oil–DXY correlation is often modest, so treat it as a signal, not a hard rule. That’s why these three series are a starting point, not the whole picture.
Supporting Data: FX Pairs, Inventories, and Risk Sentiment
Supporting indicators help you tell the difference between a true dollar move and a supply or sentiment shock.
Use:
- FX pairs: EUR/USD, USD/JPY, USD/CNY, and USD/INR to separate broad dollar moves from region-specific demand signals
- EIA inventories: Weekly EIA inventory data to split supply shocks from FX-driven moves
- Risk sentiment: VIX and the S&P 500 to see whether an oil move is tied to growth fears or a risk-off shift
A minimal daily table looks like this:
| Field | Example Value (07/15/2026) |
|---|---|
brent_front_month_usd_per_bbl |
$83.45 |
wti_front_month_usd_per_bbl |
$79.10 |
dxy_index_level |
104.25 |
eurusd |
1.0850 |
usdjpy |
158.40 |
total_us_crude_inventory_barrels |
441,700,000 |
inventory_change_vs_prior_week_barrels |
−7,500,000 |
spx_index_level |
5,250.35 |
vix_index_level |
16.75 |
Use OilpriceAPI to pull Brent and WTI into the same daily table as your FX and inventory data. Once the series line up, the next step is to convert them into returns and test rolling correlation.
Build a Simple API Workflow for USD–Oil Correlation
Use the daily table to set up a simple workflow: refresh prices, calculate returns, check rolling correlation, and tag the current regime. That gives you a clean way to test whether day-to-day USD moves are putting pressure on crude or giving it support.
Pull Brent and WTI Data and Align It with Forex Data
Start by requesting historical Brent and WTI prices from OilpriceAPI with the GET /v1/prices/historical endpoint. Pass your start_date and end_date parameters, and use the commodity codes BRENT_CRUDE_USD and WTI_USD so each pull stays separate and easy to track. The API returns JSON with ISO 8601 UTC timestamps, which makes cross-series alignment pretty painless.
Then pull your USD proxy, such as DXY or a major FX pair, over the same date range. After both feeds are loaded, convert every timestamp to UTC for computation and resample to one daily close time, such as 4:00 p.m. ET. Drop any row with a missing value in either series.
Now you have a synchronized table where each row is one matched oil-dollar observation. From there, you can check whether the dollar is driving short-term crude moves.
Convert Prices to Returns and Check Rolling Correlation
Next, compute log returns for each series with ln(P_t) - ln(P_{t-1}). Log returns stack neatly over time and deal with large price swings better than simple percentage changes.
Once you have return series for Brent, WTI, and your USD measure, run a rolling Pearson correlation over a 20- or 60-trading-day window. In pandas, it can be as simple as .rolling(window=20).corr(). Use these cutoffs: ≤ -0.5 for strong negative, -0.3 to +0.3 for weak, and > +0.3 for mixed-to-positive.
| Rolling Correlation (Oil vs. USD) | Regime Label | What It Suggests |
|---|---|---|
| ≤ −0.5 | Strong Negative | USD strength is often associated with falling oil prices |
| −0.3 to +0.3 | Weak | USD moves explain little of oil's short-term behavior |
| > +0.3 | Mixed-to-Positive | Oil and USD may move together, often when supply or macro factors dominate |
It also helps to visualize the result in two ways:
- Plot the rolling correlation as a time series
- Add a scatter plot of paired daily returns
A downward slope in the scatter plot points to an active inverse relationship. A loose, messy cloud usually means the link is weak.
Automate the Daily Monitoring Process
Once the daily correlation check is working, automate the whole process so you can track the regime each trading day. Schedule the pipeline to run once per day after the U.S. market close at 4:00 p.m. ET. You can use cron on Unix or Task Scheduler on Windows.
The script should:
- Call OilpriceAPI for the latest Brent and WTI data
- Pull matching FX data
- Recompute returns
- Recalculate the 20-day and 60-day rolling correlations
- Write a regime label to a log file or dashboard
OilpriceAPI also has a dedicated GET /v1/analytics/correlation endpoint with a type=rolling parameter. That endpoint can return pre-calculated rolling correlations plus a stability metric, defined as the standard deviation of rolling correlation.
A lower stability value means the USD-oil relationship has been more consistent. If stability starts climbing, that's often a sign the regime may be shifting and the correlation is getting noisier.
How to Read Brent and WTI During USD Rallies and Pullbacks
Use the daily correlation output to sort each move into one of two buckets: USD-led or fundamentals-led. That sounds technical, but the idea is simple. You’re trying to figure out whether crude is moving because of the dollar, or because something in the oil market itself is doing the heavy lifting.
What a USD Rally Usually Means for Crude Prices
A USD rally often shows up in a pretty clear pattern: more days when DXY or a broad USD basket rises by more than 0.5%, while Brent and WTI stay flat or move lower. At the same time, 20-day correlations usually turn negative.
One study found that a 1% gain in the dollar lines up with about a 2.1% drop in Brent prices over the sample period.
That said, the dollar doesn’t always run the show.
During the March 2022 Russia–Ukraine shock, Brent jumped even as the dollar strengthened. If your workflow shows a steady USD uptrend, but oil-dollar correlations are near zero or even positive, and crude is climbing on supply news, treat that move as fundamentals-led rather than currency-driven.
What a USD Pullback Usually Means for Crude Prices
A weaker dollar usually looks like the mirror image. You’ll often see more USD-down, crude-up days, along with more negative 20-day correlations.
But if the dollar is slipping and crude is still flat or falling, that’s a sign something else is in control. In most cases, the pressure is coming from inventories, demand, or OPEC+ supply.
Why Brent and WTI May React Differently to the Same USD Move
Brent and WTI don’t always move in lockstep, even when the dollar gives both of them the same push.
Brent has more exposure to global seaborne supply. WTI reacts more to U.S. inventories, Cushing, and pipeline conditions. So during a USD rally, WTI can drop harder than Brent if U.S. stockpiles are high and domestic logistics are tight. On the flip side, during a USD pullback, Brent may run higher if seaborne markets are tightening while U.S. supply is still ample.
This is where the spread matters. Looking at the spread alongside correlation helps you tell whether FX is driving the move or whether regional oil market forces are taking over.
| Signal in Workflow | Likely Driver | Practical Implication |
|---|---|---|
| Strong negative correlation, spread stable | USD is the primary driver | Dollar moves are a clear short-term signal for both benchmarks |
| Weak or near-zero correlation, spread stable | Demand or macro factors dominating | Reduce weight on the USD signal; check inventory and market sentiment data |
| Weak correlation, spread widening or narrowing | Regional supply or logistics divergence | Analyze Brent and WTI separately; the spread reflects structural differences |
| Positive correlation, prices rising | Supply shock | Treat the move as fundamentals-led; do not rely on the USD signal |
Before acting, do a quick sanity check. Inventories, holidays, or contract rolls can explain a move that looks dollar-driven at first glance.
Basic Checks Before You Act on the Signal
After you calculate rolling correlation, make sure the move is actually real before you tag it as USD-led. A neat-looking correlation can still point you in the wrong direction when data gaps, timestamp mismatches, or contract rolls bend the series out of shape. Before you trade or report on the signal, run two simple checks. They help you avoid treating plain data noise like a currency move.
Check for Missing Data, Holiday Gaps, and Contract Roll Effects
First, line up Brent and WTI in UTC before you compare intraday timestamps. Use ISO 8601 formatted strings, such as 2026-01-15T00:00:00Z, so every series sits on the same UTC clock.
Then look at your observation count. If an API response comes back with fewer data points than expected, the reason is often a regional holiday or an exchange-specific gap. Drop or fill missing rows the same way across the dataset before you calculate correlation.
Contract rolls deserve a close look too. They can create price jumps that have nothing to do with USD moves or supply shifts. Check roll dates, and use contract_month and front_month metadata so you're comparing like-for-like prices.
Separate FX Moves from Supply and Demand Events
Once the data is clean, test whether the move came from news rather than the dollar. If a major inventory release or an OPEC+ announcement hits around the same time, treat the USD signal with caution. Any correlation reading near major inventory, OPEC+, IEA, or geopolitical events should be flagged.
Geopolitical shocks need the same approach. In March 2026, the Iran-Israel conflict triggered sharp price spikes in oil benchmarks driven by supply fears, not USD moves. If annualized crude volatility is above 40%, downweight the USD signal because market fundamentals are taking over.
Use the table below as a fast filter to sort USD-led moves from event-led ones:
| Driver Type | Key Indicator to Watch | Scope |
|---|---|---|
| Supply | OPEC+ Ministerial Meetings | Global (Brent & WTI) |
| Supply | EIA Weekly Inventory Reports | Primarily North American (WTI) |
| Demand | China Manufacturing PMI | Global import demand |
| Geopolitical | Strait of Hormuz disruptions | Global (high impact on Brent) |
| Currency | DXY (US Dollar Index) | Global pricing channel |
Conclusion: Use USD Sensitivity as One Input Among Many
Brent and WTI are priced in U.S. dollars, so when the USD moves, crude gets cheaper or more expensive in local-currency terms for buyers outside the United States. That link isn’t just theory. One study estimates that a 1% drop in the dollar’s nominal effective exchange rate is tied to about a 2.1% increase in Brent prices.
Most of the time, oil and the USD move in opposite directions. But that relationship doesn’t stay fixed. It changes over time, which is why it makes more sense to measure correlation on returns instead of raw prices.
A practical setup is pretty simple: pull Brent, WTI, and FX data on a set schedule - using OilpriceAPI for oil prices - then line up the timestamps, calculate rolling correlations, and watch for regime shifts as those correlations tighten, loosen, or drift toward zero. At that point, the hard part isn’t the math. It’s reading what the market is saying.
Once that correlation view is live, split USD-led moves from oil-led moves. If crude is climbing even as the dollar gets stronger, or sliding even as the dollar gets weaker, look past FX and check the usual drivers:
- inventories
- supply disruptions
- refinery runs
- OPEC+ decisions
- risk sentiment
That’s where context matters. Brent and WTI can still move in different ways because local supply and demand conditions aren’t the same.
And that’s the whole point of the model: use USD sensitivity as a sanity check, not as a trading rule on its own.
FAQs
Why does a stronger U.S. dollar usually pressure Brent and WTI?
Because crude oil is priced around the world in U.S. dollars, a stronger dollar makes Brent and WTI cost more for buyers outside the United States. That added expense can cool demand and put downward pressure on oil prices.
When the dollar weakens, oil becomes relatively cheaper for international buyers. That can help support prices.
For that reason, many investors track the U.S. Dollar Index (DXY) alongside OilpriceAPI data to get more context on what the market is doing.
When do oil prices rise even as the dollar gains?
A stronger U.S. dollar often pushes oil prices down. But Brent and WTI don't always follow that script.
They can still move up when supply and demand take the wheel.
That tends to happen during supply disruptions, surprise OPEC+ production cuts, infrastructure bottlenecks, or sharp demand spikes. In those moments, oil prices can temporarily break away from moves in the dollar.
How often should I check rolling correlation between USD and oil?
Check the rolling correlation between the USD and oil as often as your analysis needs. The default analytics endpoint uses a 30-day window.
Oil prices from OilpriceAPI can move every 5 minutes, so your check cadence can be tighter or looser based on your style. If you're day trading, you may want to watch it more often. If you're looking at longer-term trends, less frequent checks usually make more sense.
You can also adjust the window parameter to make the correlation more or less sensitive.