If you need one trusted place to check fuel prices, the setup is simple: one backend calls the API, a short cache cuts repeat requests, a daily snapshot table stores history, and a read-only UI shows current and past prices. That gives dispatch, finance, procurement, and analysts the same answer at the same time.
I’d boil the article down to this:
- Keep API calls on the server, not in the browser
- Cache live prices for up to 5 minutes to cut duplicate lookups
- Store one daily snapshot per commodity for history and audit use
- Show timestamps clearly so users know how old the data is
- Send normalized data to the ERP and leave pricing rules there
- Use fallback data when the live API call fails
A few details matter a lot in practice. The live flow centers on GET /v1/prices/latest, the cache key should match business context like commodity and region, and the UI should show dates in MM/DD/YYYY and local U.S. time such as 07/13/2026 10:15 AM CT. For history, one immutable row per commodity per day gives finance a fixed answer for reviews, reports, and invoice checks.
Here’s the core idea in one view:
| Part | Main job |
|---|---|
| Backend | Calls OilPriceAPI, normalizes data, hides the API key |
| Cache | Stores the latest shared value for about 5 minutes |
| Snapshot table | Stores daily price history with timestamps |
| UI | Shows live price, recent history, and exports |
| ERP handoff | Pulls normalized snapshot data on a schedule |
The big point: this portal is a view and handoff layer, not a second pricing system. It shows market data, stores dated records, and passes clean numbers downstream. Your ERP still handles surcharge formulas, contract terms, taxes, and postings.
If I were building it, I’d start with a single backend instance, in-memory cache, one snapshot job per day, and a read-only screen with clear “last updated” labels. Then I’d move to Redis once more than one app instance or team depends on the same live value.
Reference Architecture: One Backend Owns API Access, Cache, and Storage
Internal Fuel Price Portal: Request Flow & Architecture
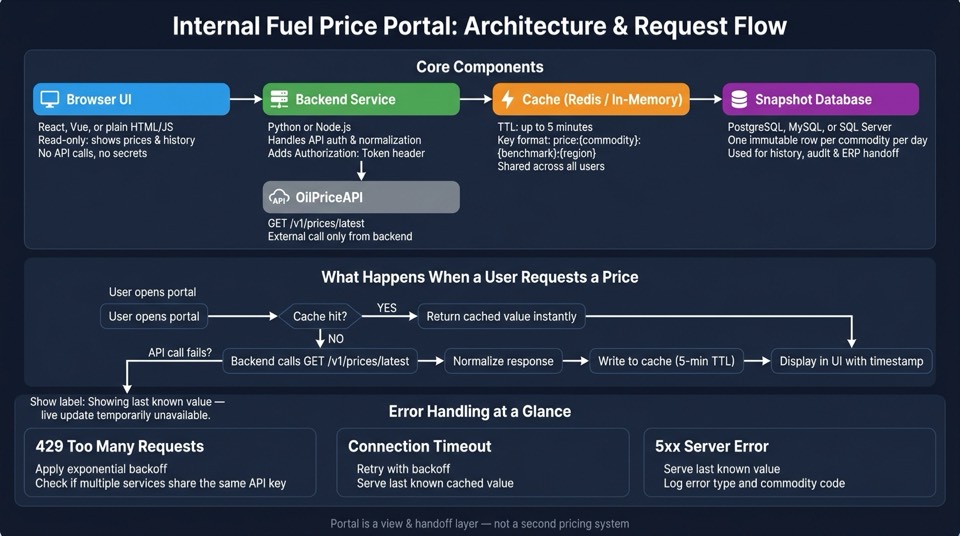
The backend is the only component that calls the API. That single rule shapes the whole portal. Live prices move through the backend, history is saved by the backend, and the browser only shows what the backend sends back.
Core Components: UI, Backend Service, Cache, and Snapshot Table
The system comes down to four parts.
The browser UI is a read-only internal interface. It shows current prices and history, but it does not call the API, store secrets, or run pricing logic.
The backend service - built in Python or Node.js - handles authentication, sends the Authorization: Token YOUR_API_KEY header on every outbound request, and normalizes the response before it reaches the browser.
A short-term cache - Redis or an in-memory dictionary - stores the latest price with a TTL of up to 5 minutes. That keeps data fresh without hitting the API more often than needed.
The last piece is a relational snapshot table in PostgreSQL, MySQL, or SQL Server. It stores daily records for trend views, audit-ready history, and ERP handoff.
| Component | Technology Options | Role |
|---|---|---|
| UI | React, Vue, or plain HTML/JS | Renders prices and history for internal users |
| Backend | Python or Node.js | Handles API auth, normalization, and routing |
| Cache | Redis or in-memory dictionary | Stores latest prices for up to 5 minutes |
| Database | PostgreSQL, MySQL, or SQL Server | Stores daily snapshots for history and ERP |
These four parts line up with the two portal modes that matter most: live lookup and daily history.
Request Flow: From User Click to Rendered Price
When a user opens the portal, the backend checks the cache first.
On a cache hit, it returns the saved value right away. No external call is needed.
On a cache miss, the backend requests the latest price from GET https://api.oilpriceapi.com/v1/prices/latest. It uses the formatted value for display, keeps the raw value for storage and snapshots, writes both to cache with a 5-minute TTL, and returns the result to the browser.
The created_at timestamp should also appear in the UI. That way, users can see how old the data is instead of guessing based on page load time.
This same request path also sets up the next pattern: short-term caching and failure handling.
Why Direct Browser Calls to the API Are the Wrong Pattern
Calling GET https://api.oilpriceapi.com/v1/prices/latest from the browser exposes your API key in network traffic. Anyone with dev tools can see it. That's the kind of problem that's easy to miss at first and painful later.
Browser code also can't protect the key or run scheduled snapshot jobs. And because the API has a rate limit, shared caching isn't optional - it's part of the design.
Putting API access in the backend gives you one place to:
- add logging
- handle
429 Too Many Requestserrors - update normalization logic without changing the UI or integrating oil prices into AI workflows
Full endpoint details and the response schema are in the API documentation.
Next, the live-price pattern shows how to pair server-side fetches with short-term caching and fallback behavior.
sbb-itb-a92d0a3
Live Price Pattern: Server-Side Fetch with Short-Term Caching
When the cache is still fresh, the backend should return that value. Once it expires, the server makes one request to GET https://api.oilpriceapi.com/v1/prices/latest with the header Authorization: Token YOUR_API_KEY, updates the shared cache, and sends the result to the UI.
That setup matters more than it might seem at first. It stops dispatch, finance, and procurement from firing off separate lookup requests for the exact same price. Instead, everyone sees the same shared value for the same moment in time. The same setup can also feed daily snapshots for history and audit trails.
Cache Design: TTL, Cache Keys, and Fallback Behavior
Your cache key should reflect the fields that make a price different in your business context. A practical format is price:{commodity}:{benchmark}:{region}. For example: price:diesel:DIESEL_USD:US_Gulf_Coast.
This keeps the portal aligned so users looking at the same business case see the same number. One thing that trips teams up: messy inputs. Normalize UI selections before building the key, so small label changes or spelling differences don't split the cache into multiple entries for what is, in practice, the same price.
A short TTL usually works best. 5 minutes is a good default. If your team is doing active quoting, a shorter window may fit better. If the data supports planning or reporting, a longer window can make more sense.
Each cached entry should include:
- Price
- Currency
- Unit
- API timestamp
For U.S. use, store timestamps in UTC on the backend and convert them only when you display them. Show the time in MM/DD/YYYY HH:MM AM/PM format and include the time zone abbreviation. For example: Last updated: 07/13/2026 10:15 AM CT.
That small detail helps a lot. Users can see how old the data is right away instead of guessing from the page load time.
Failure Handling: Last Known Value, Logs, and Alerts
If the upstream call fails, users should still get something they can act on instead of a blank screen. Treat 401 Unauthorized as a credentials problem and check the API key in your environment variables. For runtime failures, the backend should not return an empty result. Serve the last known good value from cache or the snapshot table, and mark it clearly in the UI.
| Error | Recommended Backend Action |
|---|---|
429 Too Many Requests |
Apply exponential backoff and check whether multiple services share the same key. |
| Connection timeout | Retry with backoff; serve the last known value from cache or storage. |
5xx Server Error |
Serve the last known value; log the error type and commodity code. |
Use a plain label so nobody misses what's happening:
"Showing last known value - live update temporarily unavailable."
If that fallback value is older than the maximum staleness threshold your team sets, show a clear error panel instead of quietly serving very old data. And if there's no cached or stored value at all, return a clear error to the UI and log an incident.
For each upstream call, log the commodity code, benchmark, cache key, request ID, status, latency, and whether the response came from cache or from a live fetch. Set alerts for sustained error rates or a sudden drop in cache hit ratio during business hours. If the live fetch fails and no fresh value exists, the snapshot table becomes the recovery source.
Backend Implementation Resources for Python and Node.js
For implementation, start with the language-specific guides below.
The Python tutorial walks through authenticated requests with the Authorization: Token YOUR_API_KEY header, response parsing, and basic error handling. From there, it's a straightforward next step to wrap that logic in Flask or FastAPI and add Redis or an in-process cache layer.
The Node.js tutorial covers the same core flow for Express or NestJS backends, including async requests and response normalization. Both tutorials give you a clean starting point for secure API access before you add caching and fallback behavior.
Historical Pattern: Daily Snapshots and a Read-Only Portal UI
Daily snapshots give finance a fixed answer for any past day. That history becomes the source for charts, tables, and exports.
Daily Snapshot Schema for Trend Views and Audit Trails
Set the grain of your snapshot table as one immutable row per commodity per day. At a minimum, each row should include:
| Field | Example Value | Why It Matters |
|---|---|---|
snapshot_date |
2026-07-13 |
The effective date users see in reports and charts |
commodity_code |
DIESEL_RETAIL_USD |
Drives filtering and grouping across all queries |
price_usd |
78.35 |
The main numeric value; store it without currency symbols |
unit |
gallon |
Prevents unit-of-measure mix-ups in exports |
source |
eia_api |
Creates an audit trail for data provenance |
source_price_timestamp_utc |
2026-07-13T18:00:00Z |
Stores both the provider-valid time and the time your job ran |
snapshot_taken_at |
2026-07-13T23:05:12Z |
Shows when your backend job ran |
For indexing, create a composite index on (commodity_code, snapshot_date) as the main index. That helps the database fetch a commodity across a date range without doing a full scan. If history stretches across several years, add monthly or yearly partitioning on snapshot_date so older data can be archived without slowing queries on newer records.
With this setup, the portal can show today’s value and a recent trend without extra API calls.
Read-Only UI Design: Current Price, Recent History, and Export Formatting
The UI should show three views. At the top, current price tiles display today’s snapshot for each key benchmark: the price in U.S. currency format, such as $78.35, the effective date in MM/DD/YYYY format, and a small delta indicator against the prior snapshot. A timestamp label like "as of 2:00 PM ET" makes freshness easier to check. This gives everyone one shared answer instead of forcing people to dig through email.
Below that, a line chart powered by the snapshot table lets users choose a commodity and a date range, such as "Last 30 days" or "Year to date", with MM/DD/YYYY labels on the x-axis.
Add a table plus export actions for CSV and XLSX. Each row should show the date, commodity code, price in USD, and source timestamp. For exports, keep the price column as a plain decimal, such as 3.68, with no currency symbols mixed in, and add a separate currency column set to USD. That keeps the file machine-readable, so it opens cleanly in Excel, Google Sheets, or a BI tool without extra cleanup. In the UI, use separators like 1,250.50, but export plain decimals for CSV/XLSX.
Treat the portal as the source of truth for approved prices. Users can filter, sort, and export. They should not edit prices or metadata there.
Spreadsheet Workflows for Analysts Using the Same API Data
Some analysts will want to work in spreadsheets instead of the portal. The Excel guide shows how to pull OilPriceAPI data into a workbook using the same API key and data model behind the portal. The Google Sheets guide shows a similar setup with Apps Script for teams that prefer a shared sheet.
Treat these spreadsheet workflows as ad hoc. They’re useful for one-off analysis, while the portal’s snapshot database stays the record for daily prices used in approvals and reconciliations. In plain terms, spreadsheets are copies of the same data, not a second system of record. When both tools use the same commodity codes, downstream ERP feeds stay aligned. That same data model also feeds ERP handoff cleanly.
ERP Integration, Operations, and Conclusion
ERP Handoff Patterns: Portal as the Source for Downstream Business Systems
Expose a versioned internal endpoint from the portal backend that returns normalized price data: instrument code, snapshot date in YYYY-MM-DD format, numeric price, ISO currency code, and unit of measure.
From there, the ERP can call that endpoint on a set schedule or during a nightly batch job. Then it applies its own logic for surcharge formulas, contract baselines, customer terms, and tax handling. That split matters. The portal should handle market data. The ERP should handle contract logic.
For audit trails, every ERP-bound record should include the source, timestamp, and snapshot_date fields from the snapshot table. When finance gets asked why an invoice or freight rate looks off, that metadata gives them a straight answer.
Define the handoff first. After that, pick the cache model that fits your deployment size.
Architecture Trade-Offs and Deployment Choices
Once the ERP handoff is set, the next call is how the portal runs in production. Two choices drive day-to-day operations: the ERP integration path and the cache topology.
| Approach | Control | Security | Operations | Complexity |
|---|---|---|---|---|
| Direct ERP → OilPriceAPI | Multiple integration points per ERP module | API keys spread across ERP environments | Each module handles retries and monitoring separately | High - harder to change when the API evolves |
| ERP → Internal Portal Backend | Single backend owns all external calls | API key lives only in the portal service | One place to monitor, log, and alert | Low - ERP consumes a stable internal schema |
That same setup also affects whether cache state stays local or shared.
| Cache Strategy | Control | Security | Operations | Complexity |
|---|---|---|---|---|
| In-memory cache only | Tied to each backend process | No external cache credentials | Simple, but cache is lost on restart; uneven across instances | Minimal - good starting point for single-node deployments |
| Shared cache service (e.g., Redis) | Centralized TTL and eviction control | Requires secure network access and authentication | Independent health monitoring; consistent across all instances | Moderate - adds infrastructure but improves resilience at scale |
Start with in-memory caching if you're running a single backend instance. Move to Redis when more than one consumer needs the same live value.
Key Takeaways and Next Step
With the handoff and deployment pattern in place, the rules are pretty simple:
- One backend owns all external API calls. No downstream system should call the API directly.
- Short-term cache keeps live lookups steady and call volume predictable.
- Daily snapshots give ERP, finance, and audit teams a fixed, timestamped answer for any past date.
- Read-only UI means the portal shows and exports prices. It does not store pricing rules or transactional data.
- Clear responsibility split keeps market data retrieval and normalization in the portal, while the ERP handles surcharge logic, contract terms, and financial postings.
The API documentation covers the integration details. The Python tutorial and Node.js tutorial walk through the server-side fetch and caching layer that supports both the portal UI and your ERP handoff endpoint. If your team still leans on spreadsheets, the Excel tutorial and Google Sheets tutorial show the same data pattern for analysts.
Get a free API key at oilpriceapi.com.
FAQs
How do I choose the right cache TTL?
Set the cache TTL based on how often the data changes.
For example, live prices refresh every 5 minutes. But EIA-based national or PADD diesel reports refresh weekly. Marine fuel and other benchmarks may run on their own source schedules, so a single TTL for everything is a bad fit.
Use the timestamp field in the API response to verify freshness. That helps you avoid stale data on one side and duplicate requests on the other.
When should I switch from in-memory cache to Redis?
Switch when your internal portal outgrows a single server or when you need cache data to stick around after the app restarts.
In-memory cache is a good fit for single-instance setups. Redis gives you a central cache that lets multiple web workers use the same data, cut duplicate API calls, and keep performance steady. Use the provided SDK to set backend storage and TTL based on your traffic needs.
What should the portal do if the live API is down?
If the live API can't be reached, the portal should show the most recent cached data instead of failing without any explanation. The UI should also display the price timestamp clearly, so users can tell how current the data is.
For retries, use exponential backoff to avoid hammering the service while it's recovering. And if there's no cached data to fall back on, show a clear Data Unavailable message instead of a raw system error.