If I compare Henry Hub, TTF, and NBP without converting units and currencies, I get the wrong answer. That is the whole point.
Here’s the short version:
- Henry Hub is the U.S. gas benchmark, usually quoted in $/MMBtu
- TTF is the Europe gas benchmark, usually quoted in €/MWh
- NBP is the UK gas benchmark, usually quoted in pence/therm
- 1 MWh ≈ 3.412 MMBtu
- 1 therm = 0.1 MMBtu
- 100 pence = £1
So if I put these prices on one chart as raw numbers, I am not comparing the same thing. I need to:
- Keep the raw record
- Convert the unit
- Convert the currency
- Store the timestamp with the quote
That last step matters too. If one quote is from 7/6/2026, 9:00 AM and another is from 7/6/2026, 9:07 AM, the spread may reflect timing drift, not just market movement.
LNG Benchmarks, Price Caps & Joint Gas Purchasing: How the EU Market Could Impact LNG Imports
sbb-itb-a92d0a3
Quick Comparison
| Benchmark | Main market | Usual quote | What I need to fix before comparing |
|---|---|---|---|
| Henry Hub | U.S. | $/MMBtu | Usually none if my standard is USD/MMBtu |
| TTF | Europe | €/MWh | Convert MWh → MMBtu and EUR → USD |
| NBP | UK | pence/therm | Convert pence → GBP, then therm → MMBtu, then GBP → USD |
I read this article as a guide for one job: build a dashboard that treats each benchmark as its own market and normalizes every quote before any spread, alert, or chart logic runs. It also shows a simple workflow with OilPriceAPI: fetch raw fields like price, unit, currency, and created_at, then run conversions in one shared layer so Python, Node.js, Excel, and Google Sheets all show the same output.
Henry Hub vs TTF vs NBP: What Each Benchmark Actually Reflects
Use the unit and currency fields before you compare prices. That step matters more than it may seem at first glance. Henry Hub is the U.S. benchmark, TTF is the continental Europe benchmark, and NBP is the UK benchmark.
Once your feed metadata is mapped, the next job is simple: make sure your dashboard shows what each benchmark actually represents.
Henry Hub: The U.S. Natural Gas Benchmark
Henry Hub is a physical pipeline hub in Erath, Louisiana, where multiple interstate pipelines interconnect. It is the delivery point for NYMEX natural gas futures and the main U.S. gas benchmark. In data feeds, it is usually quoted in USD per MMBtu.
TTF: The Continental Europe Natural Gas Benchmark
TTF (Title Transfer Facility) is a virtual trading point in the Netherlands. TTF is usually quoted in EUR per MWh, so you need to convert both the unit and the currency before comparing it with Henry Hub.
NBP: The UK Natural Gas Benchmark
NBP (National Balancing Point) is the UK benchmark. NBP is usually quoted in pence per therm, so divide by 100 to get GBP, then convert therms to MMBtu before comparing it with Henry Hub or TTF.
Here’s a quick reference for how the three benchmarks compare at the system level:
| Benchmark | Region | Hub Type | Typical Unit | Typical Currency | Common Dashboard Concern |
|---|---|---|---|---|---|
| Henry Hub | North America | Physical pipeline hub (Louisiana) | MMBtu | USD | USD/MMBtu baseline |
| TTF | Continental Europe | Virtual trading point (Netherlands) | MWh | EUR | Requires MWh→MMBtu and EUR→USD conversion |
| NBP | United Kingdom | Virtual trading point | Therm | Pence (GBP) | Quoted in pence per therm; divide by 100, then convert therms to MMBtu |
The next problem is normalization: the three benchmarks use different units and price scales.
Units and Conversion Traps When Displaying All Three Benchmarks Together
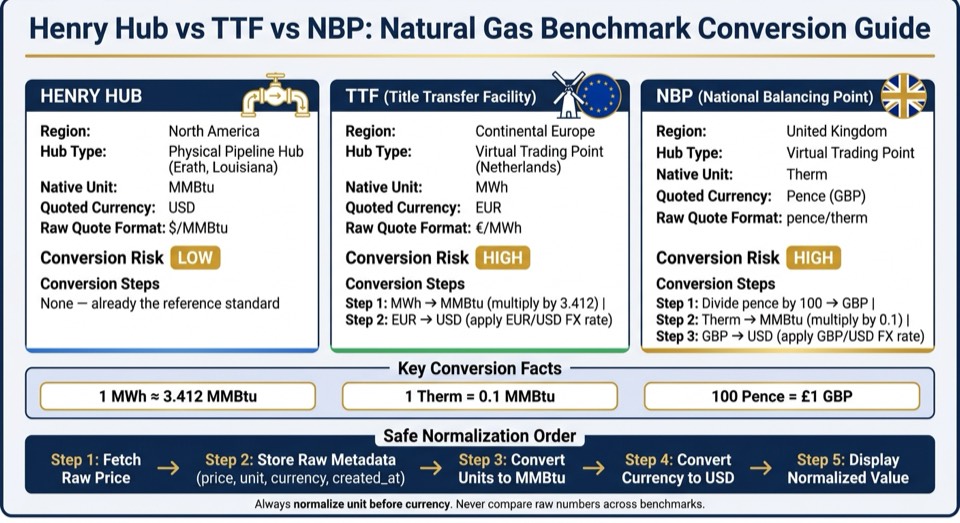
Henry Hub vs TTF vs NBP: Natural Gas Benchmark Comparison & Conversion Guide
Once you know which benchmark you're showing, normalize the unit and currency before comparing anything. This is where people get tripped up fast: three benchmarks, three units, and three currencies. The clean way to handle it is simple. Do the conversion one time in a separate layer, then pass those cleaned values into your charts, alerts, and spread logic.
| Benchmark | Native Unit | Quoted Currency | Normalized Unit | Conversion Risk |
|---|---|---|---|---|
| Henry Hub | MMBtu | USD | USD/MMBtu | Low - already the U.S. reference unit |
| TTF | MWh | EUR | USD/MMBtu | High - requires both MWh→MMBtu and EUR→USD conversion |
| NBP | therm | GBP (quoted in pence) | USD/MMBtu | High - divide pence by 100 first, then convert therms to MMBtu |
MMBtu vs MWh vs Therm: Do Not Compare Raw Numbers
These energy units are not interchangeable. 1 MWh ≈ 3.412 MMBtu, and 1 therm = 0.1 MMBtu. So a TTF quote in EUR/MWh already refers to a bigger energy amount per unit than a Henry Hub quote in USD/MMBtu.
That’s why raw prices can fool you. If you plot them on the same axis before converting, you’re not making a clean like-for-like comparison. You’re mixing different unit sizes and calling it a trend.
NBP adds one more trap. It’s quoted in pence per therm, so you need to divide by 100 before doing any unit conversion.
Currency Normalization Is as Important as Unit Normalization
Unit conversion comes first. FX conversion comes after that.
If your standard is USD, convert TTF with EUR/USD and NBP with GBP/USD only after the unit has been normalized. If you skip that order, the ranking on your dashboard can end up showing currency swings instead of changes in gas prices.
A Safe Normalization Pattern for Multi-Benchmark Dashboards
Keep raw values and normalized values separate. Store the raw price, benchmark name, native unit, quoted currency, and timestamp as separate fields in your database. Then run unit and currency conversions in a dedicated transformation layer, such as a service function or pipeline step, before the data reaches your chart, alert engine, or spread calculator.
That separation helps with auditability. If a conversion factor changes, or an FX rate turns out to be stale, you can reprocess the raw records without losing the original data.
Building Benchmark-Aware Dashboards with OilPriceAPI
Pull Prices First, Then Convert
Once your normalization rules are set, the next move is simple: pull the raw benchmark data first and only convert it after that.
Use the latest-prices endpoint to store raw benchmark records before any conversion:
GET https://api.oilpriceapi.com/v1/prices/latest
Authorization: Token YOUR_API_KEY
Pull Henry Hub, TTF, and NBP from the latest-prices endpoint, then store price, currency, unit, and created_at before normalization. That created_at field matters more than it may seem at first glance. It helps confirm that the prices you're comparing came from the same pull, not from different moments mixed together.
For full reference on available codes and parameters, see the API documentation.
The same raw-data pattern works whether you're writing code or building in a spreadsheet.
Apply the Same Pattern in Python, Node.js, Excel, and Google Sheets
Use the same fetch-then-convert flow in every client. In plain English: get the raw price, keep the metadata, then run the conversion in one shared place. That way, every dashboard shows the same result for Henry Hub, TTF, and NBP.
A good rule of thumb is to follow best practices for integrating commodity APIs by centralizing the conversion logic in one shared function or formula. If one team converts prices in Python one way and another team uses a slightly different Excel formula, your dashboard can drift fast. Same source, same logic, same output.
OilPriceAPI has dedicated implementation guides for each environment. The Python tutorial, Node.js tutorial, Excel guide, and Google Sheets guide show how to pull live prices into code or spreadsheets while keeping the same unit, currency, and created_at metadata, so each environment applies the same conversion rules.
Conclusion: Pick One Display Standard and Keep Benchmark Metadata Intact
Henry Hub is the U.S. benchmark in USD/MMBtu. TTF is Continental Europe in EUR/MWh. NBP is the UK benchmark in pence per therm. Put those raw numbers side by side without normalizing them, and you’re not making a like-for-like comparison.
Start by normalizing the unit. Then convert to one currency using current FX rates. Show the normalized values in the dashboard, but keep the raw price, currency, unit, and created_at fields in storage.
For implementation, three rules matter most:
- Store the benchmark identifier with every record. Keeping the benchmark name with each entry stops generic "Natural Gas" labels from muddying multi-benchmark comparisons. Understanding commodity price insights helps contextualize these shifts.
- Never compare unnormalized values. If a dashboard skips unit conversion, the numbers may look like market signals, but they’re just artifacts of different units.
- Build around unit-safe and currency-safe transformations. That split helps keep dashboards accurate and lets technical analysts trace each value back to its source.
If you need live data, pull raw values first and normalize them downstream. Get a free API key at https://www.oilpriceapi.com and start pulling live benchmark data.
FAQs
Which unit should I standardize on?
There’s no one-size-fits-all unit for natural gas. The right unit depends on the market you’re looking at.
For example:
- Henry Hub is quoted in USD per MMBtu
- UK NBP is quoted in pence per therm
- TTF is quoted in EUR per MWh
That difference matters. These benchmarks use different energy units and different currencies, so you can’t compare them side by side as-is.
If you’re showing all three in one dashboard, convert them to a shared unit like MMBtu or MWh first. That way, you’re comparing like with like instead of mixing apples and oranges.
How often should I refresh FX rates?
For natural gas benchmarks like Henry Hub, TTF, and NBP, refresh every 60 seconds during active market hours. That keeps dashboards and integrations current without burning through your request quota.
Pull the latest pricing from the latest prices endpoint. If you want to use data more efficiently, set up webhook alerts for specific price moves instead of relying only on polling.
What timestamp should I use for spreads?
Use the timestamp in the API response for each price point.
Henry Hub, TTF, and NBP run on different exchange schedules and market hours, so they won’t always update at the same moment.
For accurate spreads, line up the data points using the closest possible UTC timestamp.