Short answer: sometimes - but only in tight windows and only in the right market regime.
I’d sum the article up like this: oil is not a steady early-warning signal for U.S. stock volatility. Short-term oil volatility can show up before stock volatility over 1, 5, 10, and 30 trading days, but the link is uneven. It tends to work better during fast stress periods, with daily data, rolling windows, and sector-level views. It tends to fail when oil and stocks are just reacting to the same news at the same time.
If you want the plain takeaway, here it is:
- Oil returns alone are weak. Oil volatility is usually the better input.
- Shock type matters. Demand shocks often hit stocks longer than short supply shocks.
- Sector effects matter. Energy, airlines, autos, industrials, and consumer names can react in very different ways.
- Timing matters. Bad timestamp alignment can create false lead-lag results.
- Risk filters matter. A Z-score above 2.0, a 7-day rolling correlation, and stable correlation variation are the main checks before using oil in live risk or hedge rules.
- Use it as a risk input first. I would treat oil as a way to update volatility views and hedge settings - not as a stand-alone trade trigger.
One point stands out: a big oil move is only useful if it comes first and the link stays steady long enough to act on. If correlation is unstable, if the move is a contract anomaly, or if equities already moved, then oil is just noise.
So the article’s bottom line is simple: trust large oil shocks only when correlation is stable, sector exposure is clear, and the regime says oil is leading - not following.
What Short-Term Data Shows About Oil Shocks and Stock Volatility
The short-term picture is mixed. In some stretches, oil volatility shows up before stock volatility over days or weeks. In other stretches, that link fades, reverses, or only shows up in certain sectors based on the type of shock and the market backdrop. That matters because it shows where oil data can help - and where it can send you in the wrong direction.
Where Short-Term Lead-Lag Shows Up in the Evidence
The main issue is simple: which oil shocks lead stock volatility, and which ones just move alongside it?
The clearest short-term signals tend to show up in daily data and 30-day rolling windows. In those cases, lagged oil volatility often appears ahead of stock volatility. That doesn’t mean oil always gives an early warning. It means the signal is most useful in short windows where price stress is building fast.
Which Oil Shocks Have the Strongest Link to Stock Volatility
It depends on the kind of shock. Oil shocks don’t all hit markets in the same way.
Demand-driven shocks tied to slower global growth usually have a more lasting effect on stock volatility than short-lived supply disruptions. Geopolitical shocks often hit first. The 2022 Russia-Ukraine war is a clear case, with oil and equity volatility jumping at the same time.
There’s another clue worth watching. When geopolitical tension rises, the Brent-WTI spread often widens too, and that can act as a useful short-term signal for broader market stress.
Why Broad Indexes and Sectors Can Tell Different Stories
This is where sector data helps. A broad index can hide a lot.
Energy producers may gain from higher oil prices, while transportation, airlines, autos, consumer discretionary stocks, industrials, and some financials can get squeezed by weaker demand or margin pressure. Those offsetting moves can leave the S&P 500 looking flat even while volatility is building underneath the surface.
That’s why sector-level data often gives a cleaner read. The same goes for refined-product spreads, like crude versus diesel or jet fuel, which can show more clearly where pressure is building in the market.
sbb-itb-a92d0a3
How to Set Up and Test Oil-to-Stock Lead-Lag in Practice
Turn the oil-to-stock lead-lag you’ve spotted into a test you can run again and again on your own data.
Regression and Lag-Window Tests for Daily and Intraday Data
Start with lagged regressions of realized or implied stock volatility against lagged oil returns and oil volatility. Test short and medium windows: 1, 3, 5, and 10 days, plus 1 month. Then be strict. Keep only the horizons that still work out of sample.
It also helps to split out negative oil shocks instead of treating all moves the same. That matters because sharp downside events can hit markets in a different way. The July 2008 and April 2020 extremes are useful stress cases.
For inputs, use futures OHLC, not spot prices. That keeps the contract-month context intact and helps you avoid mistakes that can happen when separate contract months get stitched into a single series. Use that same futures series for risk settings too. Position sizing and stop-loss levels should come from 30-day rolling volatility taken from the same data source.
Spillover, Rolling Correlation, and Shock Decomposition Frameworks
Rolling checks help you figure out whether a signal is steady enough to trade or too shaky to trust.
A 7-day rolling correlation between oil volatility and stock volatility is a good starting point for spotting short-term regime shifts. Don’t stop at the correlation itself. Track the standard deviation of that rolling correlation too. Lower variability points to a steadier signal. If that standard deviation jumps, you’re probably dealing with a mixed regime, and oil signals deserve a lot more doubt.
If the signal won’t hold still, pause and sort out the shock before putting on a trade. Break oil moves into supply, aggregate-demand, and precautionary-demand shocks. Similar price moves can lead to very different equity-volatility effects.
Data Requirements and API-Based Implementation
Once you’ve set the signal rules, check the plumbing. You need timestamp-aligned WTI and Brent futures, matched U.S. equity index data, and both historical and live commodity series if you want intraday monitoring.
Timestamp alignment is non-negotiable. If the series are off, even by a bit, you can introduce look-ahead bias. And that can make a lagged link look stronger than it is. For live monitoring, 5-minute updates during market hours are common for energy benchmarks.
OilpriceAPI offers JSON REST data for Brent Crude, WTI, Natural Gas, and Gold, along with source timestamps and freshness metadata. That makes it useful for checking synchronization before you test signals and for live volatility monitoring once the setup is in place.
When Oil Moves Fail as a Leading Indicator
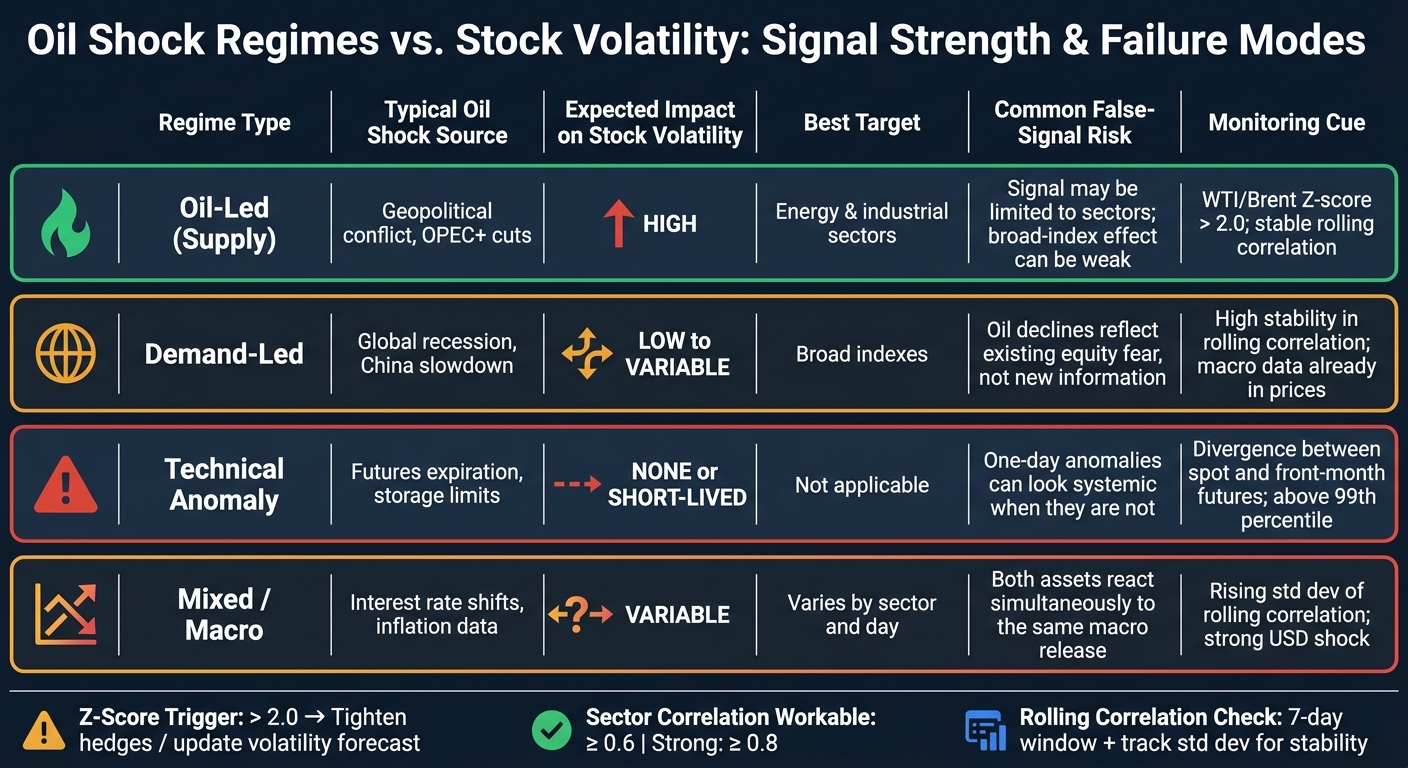
Oil Shock Regimes vs. Stock Volatility: Signal Strength & Failure Modes
Not every move in crude tells you something new about stocks.
Sometimes oil is just reacting to the same headline that equities have already absorbed. That’s why regime checks matter so much. They act as the filter before you treat oil as a signal for future stock volatility.
Equity-Led and Mixed Regimes
In equity-led or demand-led regimes, stocks often move first and oil reacts after that. When that happens, the usual lead-lag setup falls apart.
If you use the oil drop as a forward signal in this kind of market, you’re flipping cause and effect. In plain English: oil isn’t warning you about stocks. It’s echoing what stocks already said. And if rolling-correlation stability starts to weaken, it’s smart to treat oil as a weak lead.
Short-Lived Shocks, Weak Aggregate Effects, and Sector Mismatch
Some crude moves look dramatic but don’t mean much for the stock market as a whole.
A one-day futures anomaly tied to contract expiry or storage stress is not the same thing as a broad equity warning. It may look loud on the chart, but that doesn’t make it market-wide.
Sector mismatch adds even more noise. A move that matters for energy or industrials may barely register in broad index volatility, especially when the aggregate effect is small. So even when the oil signal is real, it may only matter in part of the market.
Comparison Table: Regimes, Signal Strength, and Key Failure Modes
| Regime Type | Typical Oil Shock Source | Expected Impact on Stock Volatility | Best Target | Common False-Signal Risk | Monitoring Cue |
|---|---|---|---|---|---|
| Oil-Led (Supply) | Geopolitical conflict, OPEC+ cuts | High | Energy and industrial sectors | Signal may be limited to sectors; broad-index effect can be weak | WTI/Brent z-score above 2; stable correlation |
| Demand-Led | Global recession, China slowdown | Low to variable | Broad indexes | Oil declines reflect existing equity fear, not new information | High stability in rolling correlation; macro data already in prices |
| Technical Anomaly | Futures expiration, storage limits | None or short-lived | Not applicable | One-day anomalies can look systemic when they are not | Divergence between spot and front-month futures; above the 99th percentile |
| Mixed/Macro | Interest rate shifts, inflation data | Variable | Varies by sector and day | Both assets react simultaneously to the same macro release | Rising standard deviation of rolling correlation; strong USD shock |
Use these regime checks before routing live oil data into trading or risk workflows. Once you know which regime you’re in, you can make a cleaner call on how live oil data should feed into those workflows.
Putting Real-Time Oil Data to Work in Volatility-Aware Workflows
If oil leads at all, that lead is only useful when it's steady enough to use. Once regime and stability checks pass, the next step is simple: turn the signal into hedging actions and volatility inputs.
Trading and Hedging Use Cases
The best near-term use for this data is as a volatility input, not as a standalone trade signal.
A practical rule is to use a WTI or Brent Z-score above 2.0 as a trigger to tighten hedges or update volatility forecasts. Then pair that trigger with sector correlation to decide what to do next. A reading of 0.6 or higher is workable, while 0.8 or higher is strong. If rolling-correlation stability starts moving up, treat that as a warning sign. The link may be breaking apart, so it's better to wait for confirmation before adding exposure.
"Z-Score measures how many standard deviations the current price is from the historical mean. > 2.0 is significantly overvalued." - OilPriceAPI Analytics Documentation
That same trigger shouldn't feed trades alone. It should also feed risk alerts.
Risk Monitoring, Scenario Analysis, and Dashboard Design
For risk teams, the job isn't just prediction. It's escalation.
A layered dashboard works well here, with three core inputs:
- real-time oil moves
- rolling correlation
- key spreads such as the WTI-Brent basis or 3-2-1 crack spread
Use stability as the alert filter. Run Z-score checks all the time, flag readings beyond ±2.0, and confirm correlation stability before sending the case to a human reviewer.
Stress tests should be tied to past extremes, like Brent's $139 spike in March 2022. You can also use historical daily returns to estimate 95% Value at Risk for sharp-move scenarios.
OilpriceAPI offers real-time and historical Brent and WTI data, 5-minute market-hour updates, WebSocket streaming on Professional plans, and analytics endpoints for Z-scores, rolling correlations, and volatility classifications.
Conclusion: What to Trust, What to Test, and What to Ignore
Use the signal only when the move is large and the correlation is stable.
More specifically, trust it only when three things line up: the move is large, the correlation is stable, and the sector link is clear. Everything else should be tested before it goes into live workflows. If you're dealing with a one-off headline move, a low Z-score, or unstable rolling correlations, that's a monitor-only situation - not something to act on.
FAQs
When does oil lead stock volatility?
Oil price swings often show up before stock market turbulence. When supply shocks hit, investors start to worry about stagflation or even an economic slowdown. And when oil jumps hard in a short span - like it did in 2008 and 2022 - that move can come before major equity sell-offs because it adds inflation pressure and fuels uncertainty.
That’s why traders and risk teams keep a close eye on signals like correlation and volatility. OilpriceAPI can make that work easier by giving you real-time and historical Brent and WTI data.
Which oil signals are most reliable?
The most reliable oil signals usually come from combining indicators, not leaning on just one.
For example, you might pair technical signals like moving average crossovers or MACD with confirming data such as trading volume and broader economic trends. That extra context helps filter out weak setups and cuts down on false alarms.
Signal quality tends to improve when a crossover holds for at least two trading periods. On top of that, adding sentiment analysis, geopolitical context, and real-time data from OilpriceAPI can make signals more dependable than technical analysis alone.
How can I avoid false oil signals?
Avoid false oil signals by looking at both the chart and the bigger market picture. If you lean on just one metric, it's easy to get faked out.
A simple rule of thumb: let crossovers or trend moves stay in place for at least two trading periods before you act. That small pause can save you from jumping on noise.
It also helps to check the signal against other tools, such as:
- Moving averages
- MACD
- RSI
- Volume
And don't stop at the chart. Oil can swing on headlines fast, so geopolitical events and economic trends matter just as much. OilpriceAPI can help you track these signals and calculate them with more precision.