You can’t connect Looker Studio straight to OilPriceAPI, so the fix is simple: use Google Sheets as the bridge.
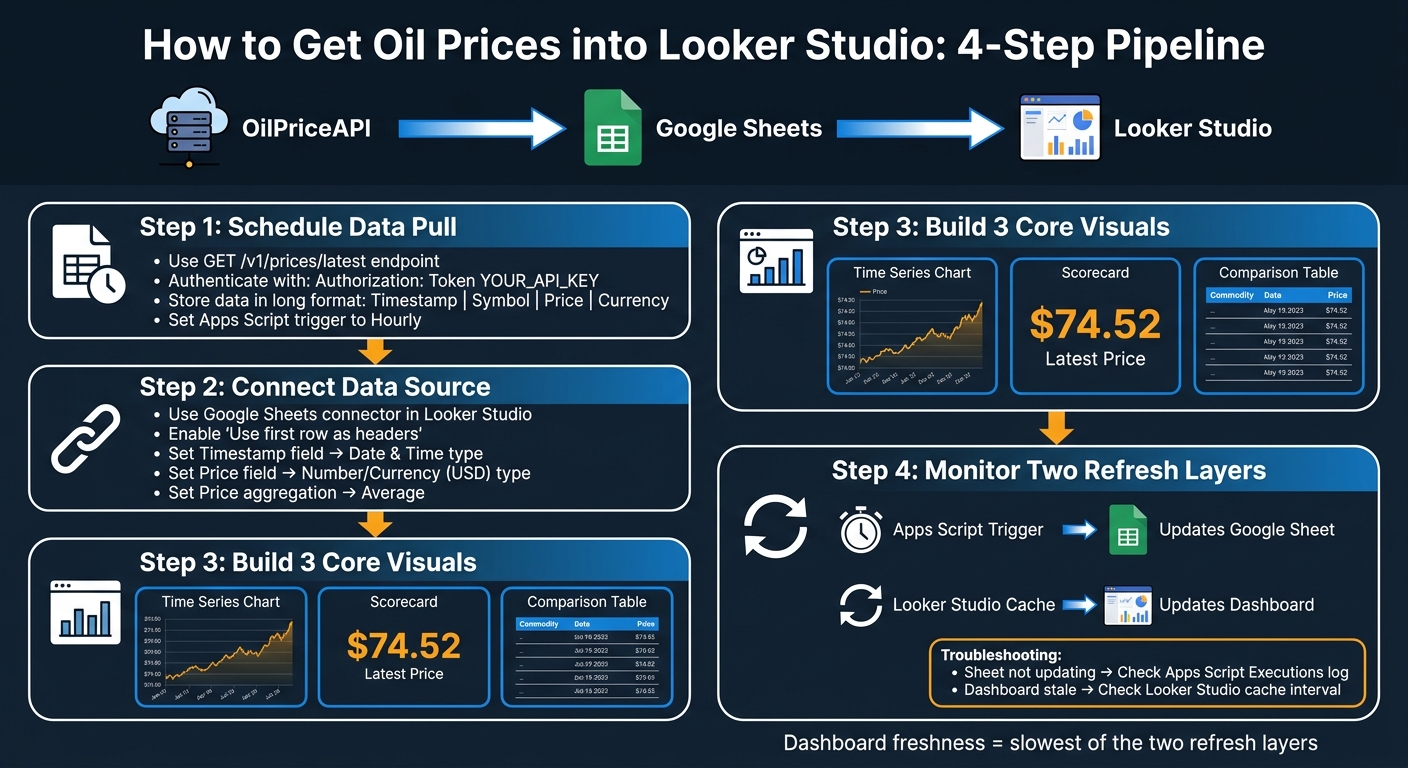
I’d set it up like this: pull GET /v1/prices/latest into a Google Sheet with Apps Script, run it on a schedule, and then connect that sheet to Looker Studio. That gives you one pipeline:
- OilPriceAPI → Google Sheets → Looker Studio
- Use
Authorization: Token YOUR_API_KEY - Log data in long format: timestamp, symbol, price, currency
- Set Timestamp as date/time and Price as a number
- In Looker Studio, use Average for price if you have more than one row per day
- Check both update layers: Sheet trigger and Looker Studio cache
A setup like this works well because your dashboard is only as current as the slowest step. If your sheet updates every hour, your report won’t show data newer than that. And if the API starts returning 429 errors, it usually means the trigger is running too often.
What matters most is keeping the sheet clean: one row per price point, no merged cells, no totals, no manual summary rows. From there, I’d build three simple report pieces: a time series chart, a latest-price scorecard, and a comparison table.
This article shows the full path in plain steps, from sheet setup to report checks, so you can keep oil price data flowing into Looker Studio without manual exports.
OilPriceAPI to Looker Studio: 4-Step Pipeline Setup
Step 1: Pull oil prices into Google Sheets on a schedule
Complete the Google Sheets tutorial first
Start with the How to Get Oil Prices in Google Sheets tutorial so your Sheet is already pulling live prices before you connect it to Looker Studio.
One small but important tip: store the API key in Script Properties instead of hardcoding it in the script. It keeps things cleaner and makes updates less of a headache later.
Once the Sheet is pulling data without issues (see our API integration FAQ for setup help), get it ready for Looker Studio.
Set up Sheet columns for Looker Studio
Use long-format data, which means one row for each price point.
A clean starter structure looks like this:
| Column | Data Type | Example Value |
|---|---|---|
| Timestamp | Date & Time | 07/07/2026 1:00 PM |
| Symbol | Text | WTI_USD |
| Price | Number | 74.52 |
| Currency | Text | USD |
These fields are what Looker Studio will use for charts and filters.
Set the timestamp column to Date time in Google Sheets by going to Format > Number > Date time. Also, make sure Price is stored as a real number, not text like "$74.52".
It also helps to keep all reporting data on a dedicated tab. Skip merged cells, images, and total rows. Those extras can trip up reporting tools.
Choose a refresh schedule that fits your dashboard
Set the trigger interval based on how often the dashboard needs new data. Hourly is enough for most dashboards. Shorten the interval only if you need closer tracking.
After the Sheet refresh is running the way you want, move on and connect it to Looker Studio in the next step.
How To Connect Google Sheets To Looker Studio As A Data Source (Tutorial 2026)
Step 2: Connect the Google Sheet to Looker Studio
Once your Sheet is logging oil prices on schedule, the next move is to connect it to Looker Studio with the Google Sheets connector.
Create a data source from Google Sheets
Open Looker Studio and click Create > Data Source. Then choose Google Sheets.
Pick your spreadsheet, then choose the tab that holds your reporting-ready oil price data.
Before you click Connect, make sure "Use first row as headers" is checked. Then click Connect to open the fields panel.
Check field types before building charts
This step helps you avoid chart issues and broken aggregations later.
In the fields panel, check these two fields:
- Date or Timestamp should be set to Date or Date & Time, not plain text.
- Price should be set to Number or Currency (USD).
If Date comes in as text, your time series charts won’t sort the right way. If Price comes in as text, averages and other aggregations won’t work at all. Fix both before you start building charts.
Also look at the default aggregation for the Price field. Set Price to Average. If your Sheet has more than one row per day, using Sum can make scorecards look inflated.
Once the source is connected, you can use these fields to build your time series, scorecards, and filters in Step 3.
sbb-itb-a92d0a3
Step 3: Build a basic oil price dashboard in Looker Studio
Once Google Sheets is connected to Looker Studio, you can turn each new row into something people can read fast. A simple setup works well here: a time series chart for the trend, a scorecard for the latest price, and a table for side-by-side checks. With that, analysts get trend, price, and comparison views from one source.
Add a time series chart for price history
Click Add a chart and choose Time series chart. Set Date as the Dimension and Price as the Metric. When Date is the dimension and Price is the metric, Looker Studio plots the price over time.
If your Sheet uses a long format - one row per date per commodity, with a separate Commodity or Code column - add a breakdown dimension so each instrument appears as its own line. Set the number format to Currency (USD) so prices show as $82.35.
Next, add a scorecard and filters so the same data is easier to scan.
Add scorecards and filters
A scorecard shows the current price right away. Add one and set Price as the metric. If your Sheet holds more than one commodity in the same tab, add a drop-down list control and use the Code or Commodity column as the dimension. That lets analysts filter the whole dashboard to one instrument, such as WTI_USD.
Place a date range control next to the drop-down. Use one drop-down and one date range control to filter the full dashboard.
Use a table to compare commodities across dates
Add a Table chart and set it up with these columns:
| Column | Field Type | Role |
|---|---|---|
| Date | Date | Dimension |
| Commodity Code | Text | Dimension |
| Price | Currency (USD) | Metric |
| Currency | Text | Dimension |
Use Price as the metric. This setup makes it easy to scan several commodities across the same date range in one place. Sort by Date in descending order so the newest rows show up first.
After the layout is ready, move to Step 4 to check refresh timing and source quality.
Step 4: Refresh, monitor, and maintain the pipeline
Once the dashboard is live, the job isn't done. You still need to keep the pipeline current and make sure it doesn't drift out of sync.
Understand the two refresh layers
Dashboard freshness comes down to two layers: the Apps Script trigger that updates Google Sheets, and Looker Studio's own refresh behavior. The dashboard can never be more current than the slower of those two layers.
Start with the Sheet. If the Sheet is stale, the issue is in Layer 1. If the Sheet looks current but the dashboard doesn't, the issue is in Layer 2. The table below helps narrow it down fast.
| Symptom | First Check |
|---|---|
| Sheet not updating | Apps Script Executions log; verify the trigger is still active |
| Sheet current, dashboard stale | Looker Studio refresh interval or cache |
401 Unauthorized in logs |
Confirm the header format: Authorization: Token YOUR_KEY |
429 Too Many Requests |
Reduce trigger frequency and check the Apps Script logs |
If the timing looks right, move on to the Sheet structure.
Watch for Sheet formatting and data quality issues
A few small Sheet mistakes can throw reporting off more than you'd think. Skip totals or summary rows in the source data. Looker Studio already aggregates raw rows, so extra summary rows can skew scorecards and charts.
For intraday prices, put the date and time in a single field. That keeps time-based reporting cleaner. It's also smart to keep the Looker Studio feed in a separate worksheet, so manual edits don't accidentally mess up the reporting sheet.
Conclusion: Use Google Sheets as the bridge to Looker Studio
Google Sheets works well as the bridge between OilPriceAPI and Looker Studio. The Google Sheets tutorial walks through the first half of the pipeline, and the API documentation includes full endpoint and authentication details.
Get a free API key at OilPriceAPI.
FAQs
How often should my Sheet refresh?
Your Apps Script trigger can refresh as often as every 5 minutes, which lines up with WTI and Brent updates during market hours. But if you want to stay inside free-tier limits, once per hour is the best setting.
In Google Apps Script, open Triggers, add a time-driven trigger, and pick the hourly interval. That keeps your dashboard current without burning through requests too fast.
Why is my Looker Studio chart showing wrong totals?
Your chart is probably showing the wrong totals because your Google Sheet mixes raw data with pre-calculated totals.
Here’s what happens: Looker Studio sees those total rows as regular rows. Then it does its own math on top of them. That can inflate the numbers or even double-count them.
The fix is simple. Remove the total rows from the Sheet and keep ONLY the raw data. After that, let Looker Studio do the aggregations in your charts and scorecards.
How do I fix stale or missing price updates?
If your data looks stale or parts of it are missing, start with your Google Apps Script execution logs. That’s usually where the problem shows up first. Look for authorization errors, failed runs, or anything that suggests the script stopped before it finished.
It also helps to double-check your time-driven trigger. If the sheet is supposed to update every hour, make sure it’s still set to run on that schedule. While you’re there, confirm that your API key is active and hasn’t expired or been turned off.
Rate limits can cause spotty updates too. When that happens, you have two simple fixes:
- Reduce how often the script refreshes
- Add caching so you’re not calling the API every time
Last piece: check the Google Sheet itself and make sure Looker Studio is reading the latest rows. Sometimes the script works, but the report is still pointed at old or incomplete data.