If commodity data is not normalized before load, your graph will break at query time. I’d boil this article down to one rule: define the ontology first, then map every feed field into that model, then validate every record before anyone uses it.
In plain English, I’m taking messy API data - like Brent at $78.88/bbl, gas at $/MMBtu, and gold at $/troy oz - and turning it into one graph where each price means one thing only. That means stable IDs for commodities and contracts, UTC timestamps, normalized units and currencies, append-only observations, source links, and checks for stale data, missing provenance, and wrong codes.
If I had to sum up the whole process in six points, it would be this:
- Define classes first: commodity, instrument, observation, currency, unit, location, and source
- Use fixed IDs: one permanent ID for each commodity, plus separate IDs for each observation
- Normalize inputs: convert time to UTC, units to standard terms, and currency to ISO 4217 codes
- Load history as new observations: don’t overwrite past prices
- Validate hard: reject missing price, unit, currency, timestamp, source, or contract data
- Expose quality flags: let downstream systems filter by freshness, completeness, and quote type
A few points matter most for trading and analytics:
- A spot price is not the same as a futures contract
created_atandupdated_atshould stay separatecontract_monthshould use YYYY-MMsource_semanticsshould tell official settlement apart from delayed reference data- Stale data can lead to bad models, bad dashboards, and bad trade decisions
Here’s the short version of the pipeline:
| Step | What I do | Why it matters |
|---|---|---|
| 1 | Define the ontology | Gives each field one meaning |
| 2 | Map API fields to graph terms | Stops field-name mismatches |
| 3 | Normalize time, units, and currency | Makes records comparable |
| 4 | Load append-only observations | Keeps price history intact |
| 5 | Link entities and provenance | Supports traceability and joins |
| 6 | Run validation and quality checks | Blocks stale, incomplete, or wrong data |
Bottom line: if you want one query-ready commodity graph, I need to treat semantics, normalization, and validation as part of the load process - not as cleanup after the fact.
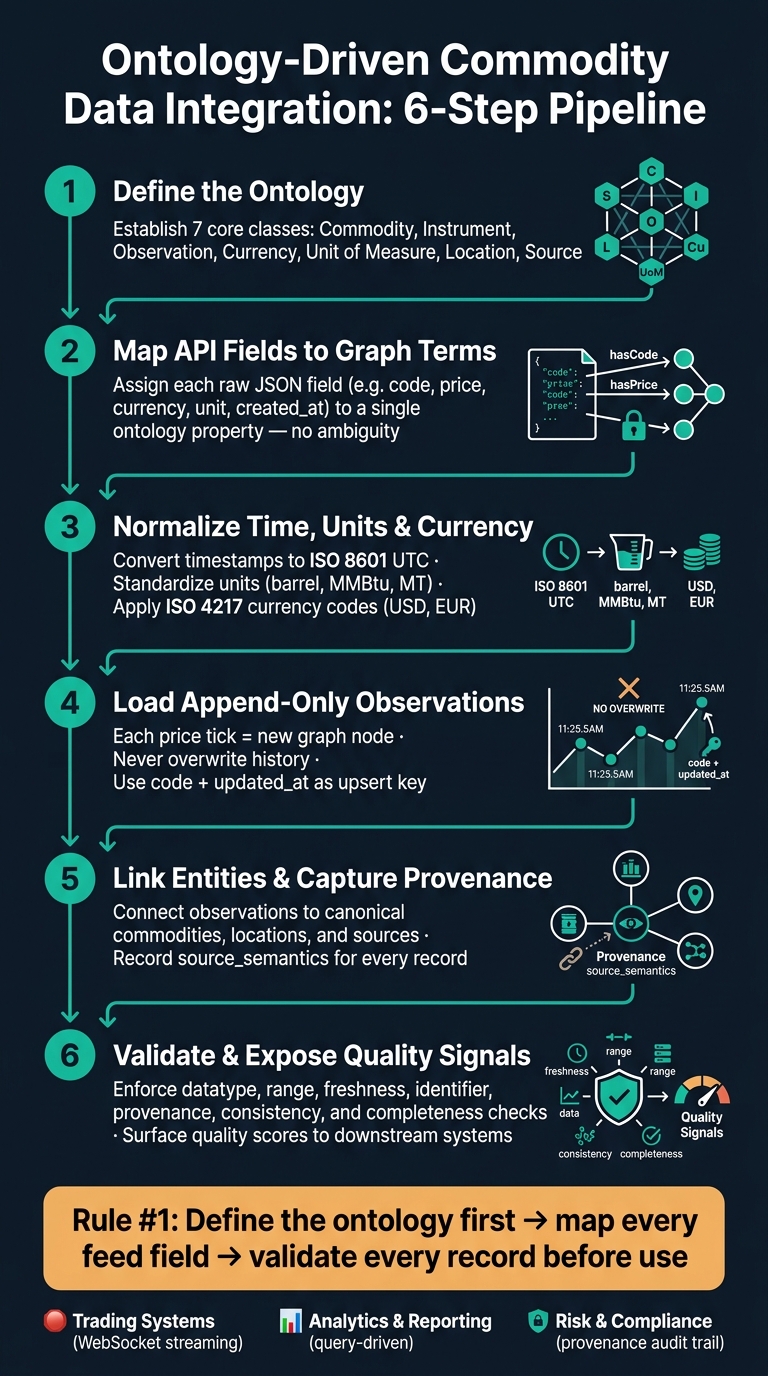
Ontology-Driven Commodity Data Integration: 6-Step Pipeline
Ontology-based Data Access made Practical, by Diego Calvanese
sbb-itb-a92d0a3
2. Design the Commodity Ontology Before Moving Data
Set the ontology before you load a single row of data. That way, each incoming field has one clear meaning. If you skip this step, mixed units, messy timestamps, and changing contract metadata can turn the graph into a headache fast.
2.1 Core classes and relationships
A workable starting point for commodity data includes seven classes: Commodity, Instrument, Observation, Currency, Unit of Measure, Location, and Source. Put simply, these classes give each field one clear place to live in the graph.
That structure protects meaning across feeds. It also helps you avoid the usual mess around units, timestamps, and quote context. A single price observation stays linked to the right commodity, contract month, source, and global oil market context.
| Core Class | Example Properties | Key Relationships |
|---|---|---|
| Commodity | code, name, category |
referencesCommodity |
| Instrument | contract_month, is_front_month |
referencesCommodity, sourcedFrom |
| Observation | price, created_at, updated_at |
observedAtTime, quotedInCurrency, hasUnit |
| Currency | code |
quotedInCurrency |
| Unit of Measure | code, name |
hasUnit |
| Location | hub_name, region |
locatedAt |
| Source | source, source_semantics |
sourcedFrom |
With those core classes in place, you can map API fields into the ontology terms.
2.2 Identifier and URI strategy
Use stable identifiers that stay the same across feeds and over time. That's what makes cross-feed linking hold up later. In practice, that means uppercase commodity codes such as BRENT_CRUDE_USD, WTI_USD, and NATURAL_GAS_USD for base commodities. For futures contracts, use the product code plus the delivery month in YYYY-MM format.
It's also smart to separate stable entities from observations. For example, BRENT_CRUDE_USD should have a permanent URI. Each observation should get its own URI and should never overwrite the commodity entity. For locations, use standard three-letter codes like RTM for Rotterdam, SIN for Singapore, and FUJ for Fujairah. For sources, stick with controlled source codes. It keeps identifiers readable and avoids clashes across feeds.
Once those identifiers are locked in, field mapping becomes deterministic.
2.3 Modeling choices that affect analytics
These modeling calls shape what analysts and traders can do later. If you want clean history, freshness checks, and contract-roll analysis without ripping things apart later, the data model has to do some heavy lifting now.
Attach price to Observation, not Instrument, so you keep history intact.
Keep updated_at separate from created_at, and treat source_semantics as a controlled label for quote type. Use source_semantics to tell settlement data apart from reference curves. Those two data types should stay separate because they support different kinds of analysis.
With the ontology in place, the next move is loading normalized API data into the graph.
3. Map API Fields to Graph Terms and Load the Data
With the ontology locked in, the next job is mapping raw JSON to graph terms. Each field should have one clear destination in the model. That way, data lands in the same place every time, and you avoid messy edge cases later.
3.1 Field-to-class and property mapping
Before you load any records, map each API field to a single graph term. Use the stable class and property names defined earlier as the only targets for incoming fields.
| API Field | Ontology Class / Property | Transformation Rule | Example Output |
|---|---|---|---|
code |
com:CommodityCode |
Use as the key for a stable URI | BRENT_CRUDE_USD |
price |
com:hasPriceValue |
Cast to decimal/float | 78.88 |
currency |
com:hasCurrency |
Map to ISO 4217 code | USD |
unit |
com:hasUnitOfMeasure |
Normalize to standard UoM term | barrel |
created_at |
com:observationTime |
Parse to ISO 8601 UTC | 2026-07-13T00:52:36Z |
updated_at |
com:sourceTimestamp |
Parse to ISO 8601 UTC; retain as source timestamp | 2026-07-13T01:15:00Z |
source |
prov:wasDerivedFrom |
Link to source entity | market_reporting |
contract_month |
com:deliveryMonth |
Normalize to YYYY-MM | 2026-07 |
For futures data, contract_month needs extra care. Normalize it to YYYY-MM, and map data_age_warning to a data quality property so stale records get flagged before they move into downstream systems.
3.2 Normalization rules for time, units, and currencies
Convert all timestamps to ISO 8601 UTC before loading. At the same time, keep the source timestamp for traceability.
Units need the same kind of cleanup. Normalize them at ingestion to standard terms like barrel, MMBtu, gallon, and MT. If the source API sends a feed-specific label, fix it during ingestion instead of pushing that work into query logic later.
Numeric precision matters too. Store price as a decimal or float using the U.S. dot separator - 74.52, not "$74.52". Leave display formatting to the presentation layer. Pricing math and volatility models need the raw numeric value.
Currencies should use ISO 4217 three-letter codes from end to end. U.S.-traded benchmarks like WTI and Henry Hub price in USD, while European benchmarks such as TTF gas use EUR. Normalize each one to the right ISO code, and keep original_currency next to the normalized value for auditing.
Once the values are normalized, load them as observations with stable identifiers and provenance attached.
3.3 Loading patterns and provenance capture
Use an append-only pattern for observations. Each price tick should become a new node in the graph instead of replacing an older one. That preserves observation history for later analysis and contract-roll logic.
Use code + source updated_at as the upsert key to prevent duplicate observations.
OilpriceAPI is a good input source here. Its REST endpoints return JSON observations for Brent Crude, WTI, Natural Gas, and Gold, and those map cleanly to the ontology classes defined in Section 2. For batch ingestion, use the interval parameter - daily, weekly, monthly - when loading historical ranges.
Capture source and updated_at on every observation for traceability.
After loading, validate links, values, and completeness before exposing the graph to downstream systems.
4. Link, Validate, and Improve Data Quality
Loaded observations only start to matter once links and validation rules make them dependable. Without that layer, a graph is just structured storage. Ontology design and field mapping build the graph; this part is what makes people trust it.
4.1 Link commodities, locations, and organizations
Use the stable IDs and normalized fields set up earlier to connect each observation to its canonical entities. Each commodity, delivery location, and data publisher should map to a controlled vocabulary so queries return the same result across datasets.
The biggest risk here is false merges. A bad merge can quietly blend records that should stay separate. To avoid that, verify instrument type first, then split records by contract_month and front_month.
Publisher names can also get messy fast. One feed may use a short label, another may use a legal name, and a third may add a suffix. Resolve those variations to one canonical organization identifier during ingestion, not at query time.
4.2 Validate structure, values, and completeness
Validate required fields before load. Shape constraints catch structural errors before load. Every incoming observation must have price, currency, unit, and timestamp present and correctly typed before the record is committed to the graph.
The table below shows the checks that matter most, what causes a failure, and what goes wrong downstream if you skip them.
| Validation Rule Type | Failure Condition | Example Violation | Downstream Impact |
|---|---|---|---|
| Datatype Validation | Price or volume is not a numeric float | "price": "78.88" |
Broken mathematical models and aggregations |
| Range Check | Value is negative or outside logical bounds | "price": -5.00 |
Distorted P&L, risk metrics, and charts |
| Freshness Check | updated_at exceeds the expected frequency |
WTI price older than 5 minutes | Execution of trades on stale market signals |
| Identifier Match | Code does not exist in controlled vocabulary | code: "BRENT_OIL" |
Failed data joins and broken dashboards |
| Provenance Check | Mandatory source or metadata fields are null | "source": null |
Inability to audit data for regulatory compliance |
| Consistency Check | Quoted currency does not match the instrument's standard currency | EUR benchmark stored as USD | Incorrect valuation and currency exposure errors |
| Completeness | Missing front_month |
Futures response without a designated lead contract | Broken forward curves; roll-over errors |
Pay close attention to source_semantics. If a feed is marked delayed_reference_non_official, it should not be treated as official settlement data in compliance reporting.
4.3 Monitor data quality over time
Once structural validation passes, keep watching the graph for drift, delay, and duplication. After each load cycle, run duplicate detection and compare data_age_warning flags against expected refresh intervals. That helps catch stale or overlapping records before they hit downstream systems.
Schema drift is the quieter problem. An upstream API can add, rename, or remove a field, and your mapping table may fail without much warning. Run automated regression tests against your field-to-property mapping after every API version update. Tools that support type inference and schema evolution - like dlt (data load tool) - can help spot unexpected structural changes before they corrupt the graph.
A shared scorecard helps make all of this visible. Surface quality score, completeness, issue count, and last update so other teams can see the state of the data at a glance.
Publish these quality signals so downstream analytics and trading queries can filter on freshness and completeness.
5. Use the Integrated Graph in Trading and Analytics Systems
5.1 Query patterns for market analysis and decision support
Once the data is validated, the graph turns into a practical query layer for trading and analytics. Because units, timestamps, and provenance are already normalized, the queries stay clean and direct. You can query Brent and WTI in USD, join units, and trace each observation back to its source, timestamp, and quote type.
That same graph also makes it easier to work with crack spreads, basis differentials, and curve-structure analysis after prices are linked to contract months and delivery locations.
For long historical windows, use aggregation intervals such as daily. That can cut result size and improve response time by a lot.
Those linked observations can also feed live systems and reporting tools without extra cleanup in the middle.
5.2 Architecture for downstream applications
After the query layer is set, the next step is deciding how consumers should access the graph. A good setup uses two access patterns that work side by side.
- For real-time trading systems, WebSocket streaming supports low-latency delivery and frequent refreshes.
- For analytics and reporting, query-driven briefs can return the latest price, 24-hour change, and forecast band.
Engineering teams can also connect AI agents through MCP servers to produce structured market summaries and support decisions. Risk and compliance services get a lot from the provenance layer too, since every observation carries source and timestamp context for audit use.
5.3 Key takeaways and implementation checklist
Use this six-step checklist to move from model to production.
| Step | Action | Why It Matters |
|---|---|---|
| 1 | Define core ontology classes first | Establishes clear relationships between prices, units, and locations |
| 2 | Map API fields explicitly to graph terms | Prevents silent mismatches between source data and graph properties |
| 3 | Create stable URIs for all entities | Prevents drift when upstream feeds change field names or codes |
| 4 | Link commodities to locations and organizations carefully | Enables accurate joins and avoids false merges across datasets |
| 5 | Validate aggressively with SHACL constraints | Catches structural and value errors before they reach trading systems |
| 6 | Expose provenance and quality signals to downstream systems | Supports audit trails and keeps downstream consumers informed |
The ontology-first approach shows its value most clearly at query time. A trader may need to compare BRENT_CRUDE_USD against WTI_USD across delivery locations. A risk model may need to confirm that every price in its input set carries a source_semantics tag that separates an official settlement from a delayed reference value.
FAQs
Why define the ontology before loading data?
Defining the ontology first gives you a standard framework for mapping different commodity datasets into one shared structure.
Put simply: it helps turn data from many sources into a consistent, reliable format. That improves both consistency and accuracy, because you’re not trying to stitch everything together on the fly.
It also makes relationships and terms clear from the start. That makes schema design easier, supports automated validation, and cuts down on errors and data silos during integration.
How do I normalize units, currencies, and timestamps?
Use OilpriceAPI’s JSON fields as your base layer. They already standardize the main technical data, which saves you from cleaning the same values over and over.
For currency, use the USD value for calculations and the formatted string - for example, $74.52 - for display. That gives you clean math on the back end and user-friendly output on the front end.
Units are also stated directly, such as "barrel". That makes it much easier to map each field in a consistent way across your ontology.
Timestamps come in ISO 8601 format, such as 2026-07-08T22:20:42Z. In Python, convert them into localized datetime objects with pandas or the standard library so your time-based analysis lines up the way it should.
What validation checks matter most before querying the graph?
Before querying the graph, validate commodity data for accuracy, freshness, and structural consistency. Check freshness metadata, including updated_at and data_age_warning, so you don’t end up using stale or incorrect values.
You’ll also want to confirm that the schema lines up with your graph needs. That includes commodity codes and contract metadata like contract months. And before ingestion, validate API responses and plan for the usual failure points: rate limits, timeouts, and network issues.