Gold in your local market can trade above or below the global price, and the gap is easy to measure. On July 11, 2026, spot gold is $4,131.18 per troy ounce. If a regional market is at $4,255.00, that is a $123.82 spread or a 3.00% premium.
Here’s the short version:
- I start with one global benchmark: spot, LBMA, or COMEX
- I compare it with the local physical gold price
- I calculate:
- Absolute spread = regional price minus benchmark
- % premium or discount = spread divided by benchmark × 100
- I check what is driving the gap:
- FX moves
- taxes and import duties
- freight, insurance, storage, and fabrication
- local demand
- supply tightness or oversupply
- I track the spread over time with:
- matched timestamps
- the same currency
- the same unit
- the same interval
If you want the cleanest read, convert both prices to USD per troy ounce, keep one benchmark fixed, and watch both the dollar spread and the percentage spread. A one-day gap can be noise. A gap that stays high for weeks often points to market friction, local cost pressure, or delivery limits.
Quick Comparison
| Item | What it shows | Why it matters |
|---|---|---|
| Spot Gold | Immediate OTC price | Common base for direct comparison |
| LBMA Gold Price | London auction benchmark | Used as a pricing reference in many markets |
| COMEX Futures | Future delivery price | Can differ from spot due to carry and funding costs |
| Regional Physical Price | Local landed price of gold | Includes FX, taxes, shipping, and local premiums |
In simple terms, this article shows how to measure the local-vs-global gold gap, how to read it, and how to build a clean historical comparison without mixing up timing, FX, or units.
Global Benchmarks vs. Regional Gold Prices: How Each Price Is Set
How Spot, LBMA, and COMEX Reference Prices Work
These reference prices set the starting point. From there, regional prices add local costs and market pressure.
Spot gold reflects the price for immediate trade. COMEX futures, on the other hand, price gold for delivery at a later date. The two can drift apart when financing costs climb or when physical supply gets tight.
How Regional Prices Reflect Currency, Taxes, and Physical Costs
Regional buyers usually begin with a benchmark quoted in USD per ounce, then convert that figure into local currency and add the costs tied to buying and moving physical gold.
That price stack often includes:
- Currency conversion
- Taxes and duties
- Transport and insurance
- Local storage
- Fabrication
Here’s what that looks like in practice:
| Price Layer | What It Covers | Example |
|---|---|---|
| Benchmark (USD/oz) | Global spot or futures reference | $4,131.18/oz |
| Currency conversion | USD to local currency at the current exchange rate | USD → local currency |
| Taxes and duties | VAT, GST, or import tariffs | Varies by market and product type |
| Physical premiums | Transport, insurance, and local storage | Higher where logistics are constrained |
| Fabrication costs | Refining and shaping gold into local products | Bars, coins, jewelry |
In plain English, regional buyers almost never pay just the benchmark price. If local supply is tight, an extra charge gets added on top. That extra amount is the physical premium - a sign that supply is strained and that moving metal into the market costs more.
Once those parts are laid out, the next step is to measure the spread with precision.
Spread Analysis: Calculating Premiums and Discounts Against the Benchmark
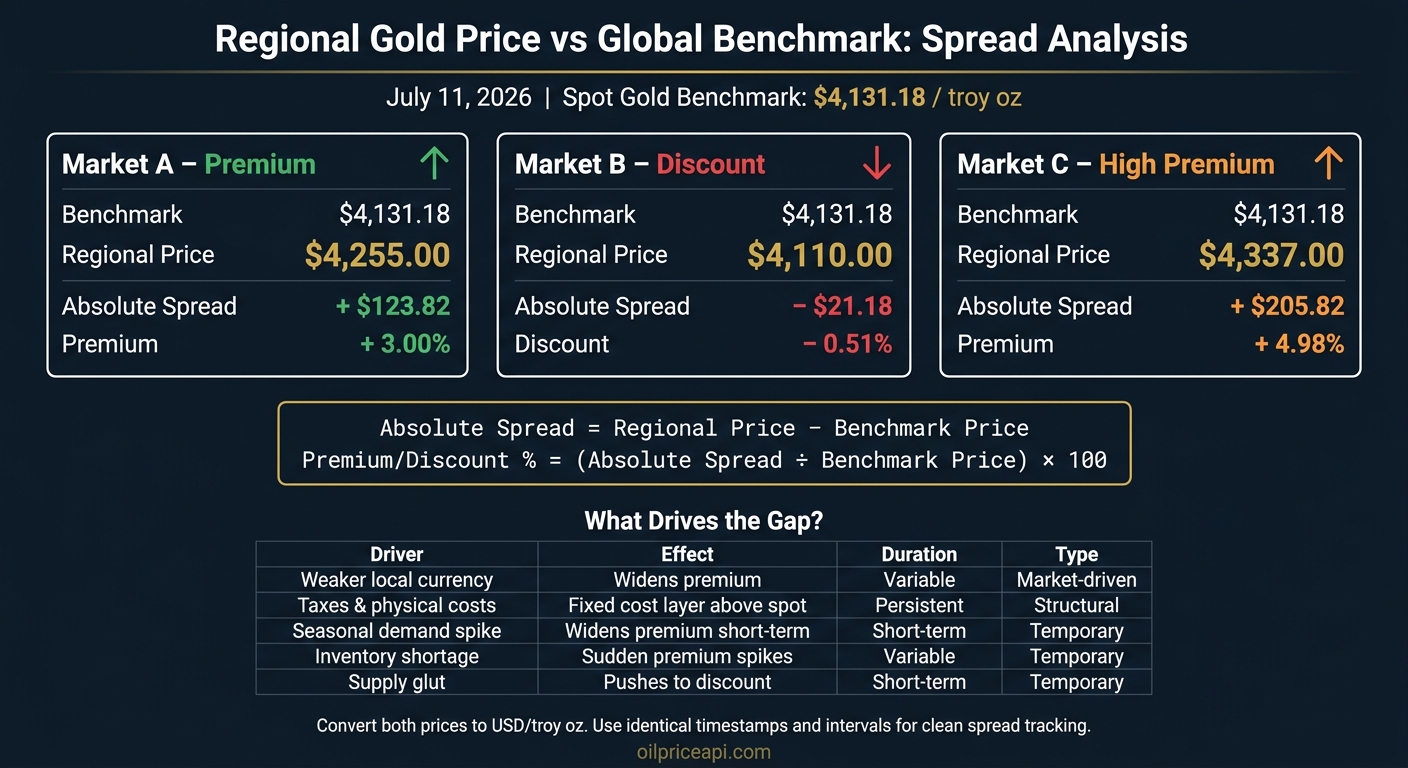
Regional Gold Price vs Global Benchmark: Spread Analysis Explained
Once you’ve pinned down landed cost, the next job is simple: compare the regional price with the benchmark. That gap is the basis spread. It shows how far a local market has drifted from the global reference price.
Formulas for Absolute Spread and Percentage Premium
Use these two formulas:
- Absolute spread:
Regional Price − Benchmark Price - Percentage premium/discount:
(Absolute Spread ÷ Benchmark Price) × 100
If the result is positive, the market is trading at a premium. If it’s negative, it’s trading at a discount. Using the spot gold price of $4,131.18/oz as of July 11, 2026:
| Benchmark Price (Spot) | Regional Price | Absolute Spread | Premium/Discount % |
|---|---|---|---|
| $4,131.18 | $4,255.00 | +$123.82 | +3.00% |
| $4,131.18 | $4,110.00 | −$21.18 | −0.51% |
| $4,131.18 | $4,337.00 | +$205.82 | +4.98% |
Before you compare prices, line up the basics: benchmark, FX rate, unit, and timestamp. If those don’t match, the spread can give you the wrong read.
How to Read a Wide or Narrow Spread
The size of the spread matters. But what matters more is whether it sticks around. These spreads later become time-series inputs for the historical comparison, so one odd print doesn’t tell the full story.
A premium that keeps showing up often points to structural friction, like currency weakness or import constraints. A short-term premium, on the other hand, usually comes from brief delivery bottlenecks or a burst of demand.
If the spread is bigger than the cost of moving gold, arbitrage should pull it back in. When that doesn’t happen, it’s a sign that logistics or regulation are getting in the way.
A discount usually points to oversupply or forced local selling.
That measured gap gives you the baseline for tracking divergence over time.
sbb-itb-a92d0a3
Why the Gap Between Regional and Benchmark Prices Changes Over Time
Once you measure the spread, the next step is figuring out why it stays wide or why it tightens over time. Regional spreads move as FX rates, taxes, freight, and local demand shift. The main thing to sort out is simple: is the driver structural, or is it temporary?
Currency Moves, Import Costs, and Local Demand Shifts
A weaker local currency makes the regional premium look larger in local terms, even if the global gold price hasn't moved at all.
Then there are the built-in costs tied to getting physical gold into a market. Import duties, taxes, refining margins, storage, and transport all add a fixed layer above the global spot price. Those are structural market factors, which is why some regional markets trade at a steady premium for long stretches.
Local demand works differently. It's often short-lived. Seasonal jewelry buying or a burst in retail investment can push regional prices above the benchmark for a few weeks. Once that demand eases, the spread often pulls back.
| Divergence Driver | Effect on Regional Premium | Duration | Type |
|---|---|---|---|
| Weaker local currency | Widens the premium in local terms | Variable | Market-driven |
| Taxes and physical costs | Adds a fixed cost layer above spot | Persistent | Structural |
| Seasonal demand spike | Widens premium during peak periods | Short-term | Temporary |
| Inventory shortage | Causes sudden premium spikes | Variable | Temporary |
| Supply glut | Pushes price to a discount | Short-term | Temporary |
Those drivers explain how big the gap gets. Arbitrage limits explain why it doesn't close right away.
Futures-Physical Gaps and Arbitrage Limits
If the regional price climbs too far above COMEX futures, traders can buy futures and sell physical gold in the local market. In theory, that should close the gap. In practice, it doesn't always work so cleanly.
Delivery constraints can slow the trade down. Financing costs can eat into the spread. Storage and transport limits can also make the trade too expensive or too hard to execute. That's why a gap can stay open longer than you'd expect.
What matters most isn't one sharp move. It's how long the spread stays stretched. A spread that remains above its one-year 90th percentile for weeks usually points to a structural change.
How to Track Historical Divergence and What the Comparison Shows
After you’ve pinned down the drivers of divergence, the next step is to measure the spread over time on a single, consistent timeline. That sounds simple, but this is where a lot of comparisons go off the rails. If the setup isn’t consistent, the chart can tell the wrong story.
To compare regional gold prices with global benchmarks over time, build one consistent time series.
Steps for Building a Clean Time-Series Comparison
The whole setup depends on consistency. Every variable - date range, time zone, currency, and unit - needs to match across both series before you calculate the spread.
- Pick one benchmark and stick with it Use one recognized global reference, such as the LBMA Gold Price or a COMEX futures contract, as the baseline for comparison.
-
Align timestamps to the same moment
Use ISO 8601 formatted timestamps, such as
2025-12-26T15:30:00Z, so the regional data and benchmark data line up at the same moment. - Convert both series to USD per troy ounce Put both series on the same basis, usually USD per troy ounce, before you plot or compare them.
- Use identical intervals Daily, weekly, or monthly - pick one interval and use it for both series.
Once that alignment is clean, the spread line starts to say something useful. You can see whether the divergence looks structural or just temporary noise.
At that point, plot both the absolute spread and the percentage premium. You want both views. The dollar gap shows the raw difference, while the percentage view shows how large that gap is relative to the benchmark. A 20-day or 50-day moving average can smooth out noise and make longer-running divergence easier to spot.
For anomaly detection, calculate the Z-score of the spread:
(Current Spread − Mean Spread) / Standard Deviation
A Z-score above 2.0 suggests the regional price is materially above its historical norm, while a Z-score below -2.0 points the other way.
If you’re building this into an automated workflow, OilpriceAPI can handle historical gold comparisons through its /v1/prices/historical and /v1/analytics/spread endpoints. That cuts down on manual alignment work and helps avoid timestamp mistakes.
Key Points for Analysts and Developers
A few things matter most in this kind of comparison:
- Use the right benchmark. Pick one recognized global reference and keep it fixed through the analysis.
- Separate currency effects from physical premiums. Convert to USD first so FX moves don’t get mixed into the spread.
- Measure both absolute and percentage spreads. A $15/oz spread means one thing when spot is at $3,500/oz and something else when it’s at $5,000/oz.
- Automate tracking to keep the series consistent over time.
- Track Pearson correlation to check that the benchmark relationship stays strong.
FAQs
Which gold benchmark should I use?
It depends on what you’re analyzing.
For most professional use, traders and investors look at spot gold prices, quoted in U.S. dollars per troy ounce. That’s the standard benchmark because it reflects the global market rate across major trading hubs like London, New York, and Asia.
OilpriceAPI provides real-time and historical gold price data through a JSON REST API, so you can track spot price moves in your models.
Why can a local gold premium stay high for weeks?
A local gold premium can stay high for weeks due to structural market factors. These include steady regional supply-demand imbalances, infrastructure bottlenecks, and high transportation or import costs.
It works a lot like basis spreads in other commodities. In plain English, the premium reflects what it costs to get physical gold delivered to one specific place instead of a global hub.
When access to global supply is tight, or local demand keeps holding up, that premium can stay elevated for longer than many people expect.
How do I avoid bad spread comparisons?
Use equivalent benchmarks and look at the forces behind regional price gaps, such as transportation costs, infrastructure bottlenecks, and local supply-demand imbalances. A spread only means something if you know what the difference is telling you.
Also, keep in mind that regional gold prices may include premiums for logistics, security, or local market liquidity that global spot references do not.