
10 API Audit Metrics for Access Review
Ten measurable API audit metrics to prove who has access, why, whether access is too broad, and that issues are fixed within SLA.
Read More →Stay informed with the latest market analysis, price trends, and industry insights from our commodity trading experts.
319 articles • Updated weekly with fresh insights
Ten measurable API audit metrics to prove who has access, why, whether access is too broad, and that issues are fixed within SLA.
Read More →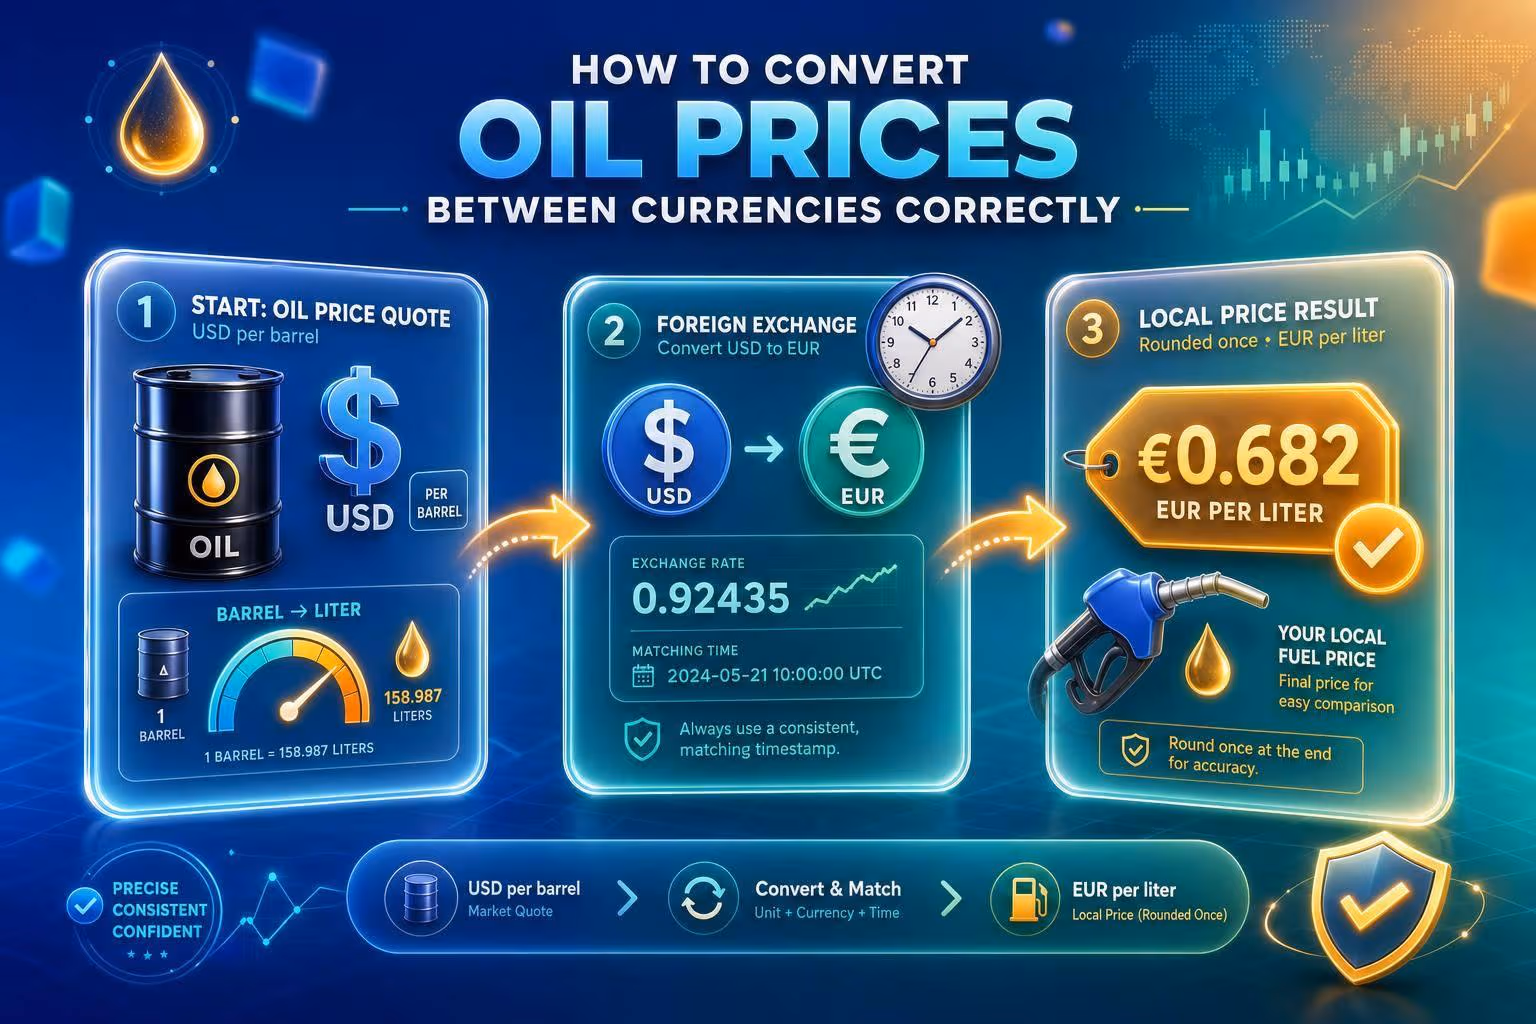
Timing and order matter: convert USD oil quotes to the right unit, use the matching FX timestamp, and round only once for correct local prices.
Read More →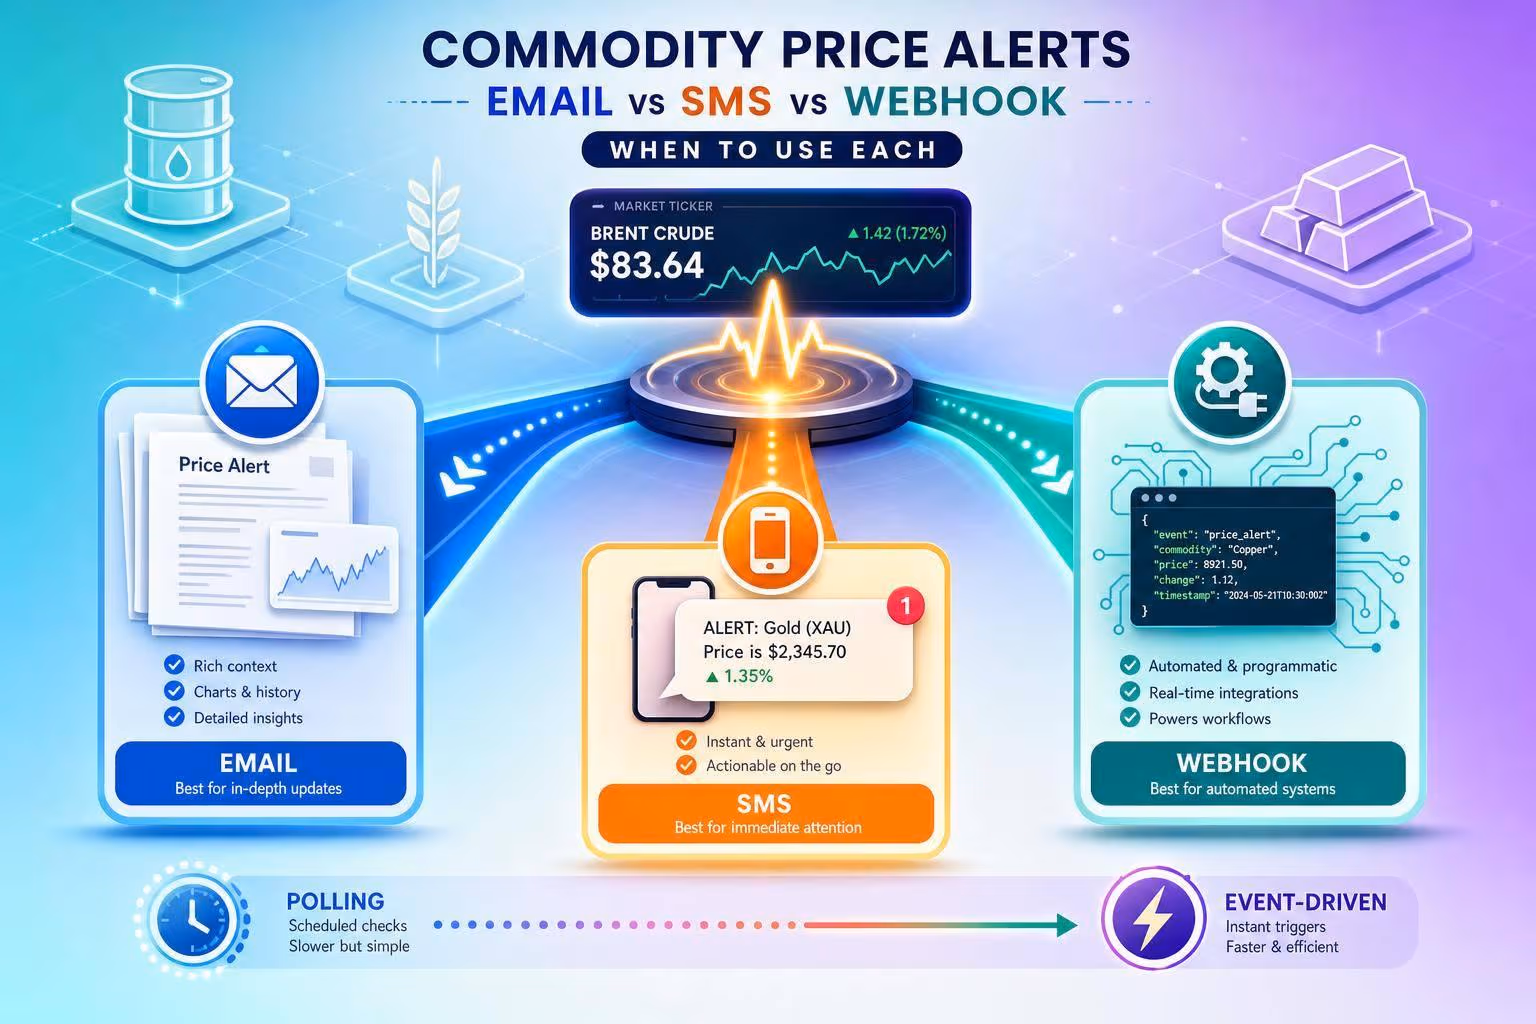
Email for context, SMS for urgent human response, webhook for automated near-real-time action; weigh polling vs event-driven checks.
Read More →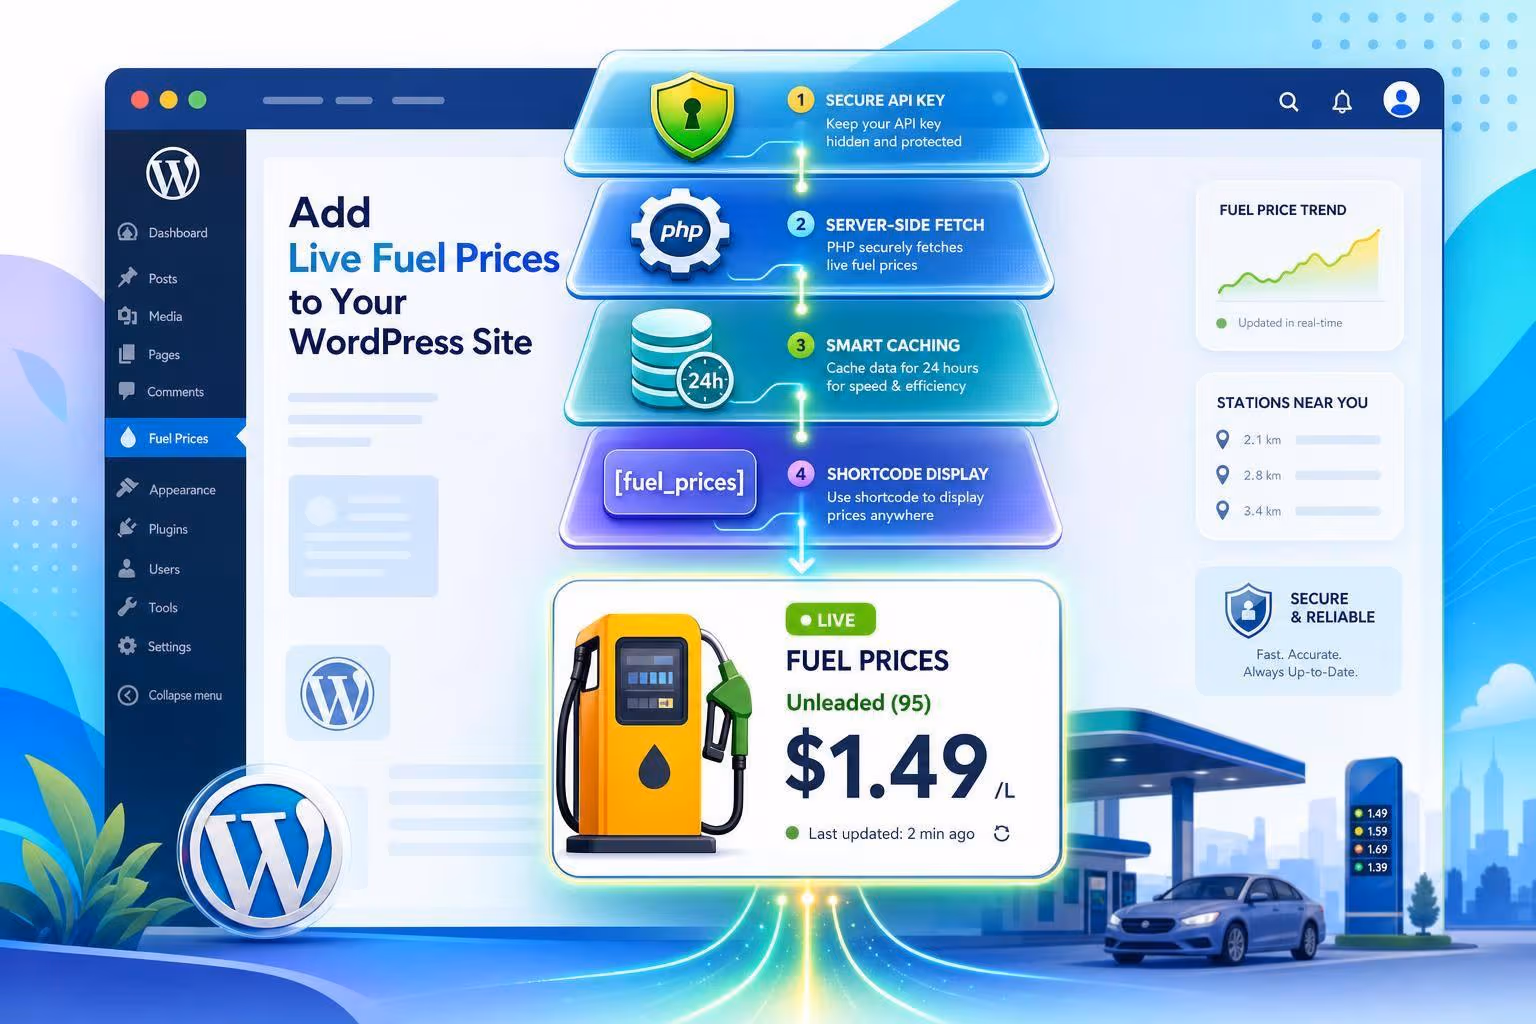
Fetch fuel prices server-side with PHP, hide your API key, cache results 24 hours, and display them via shortcode or template.
Read More →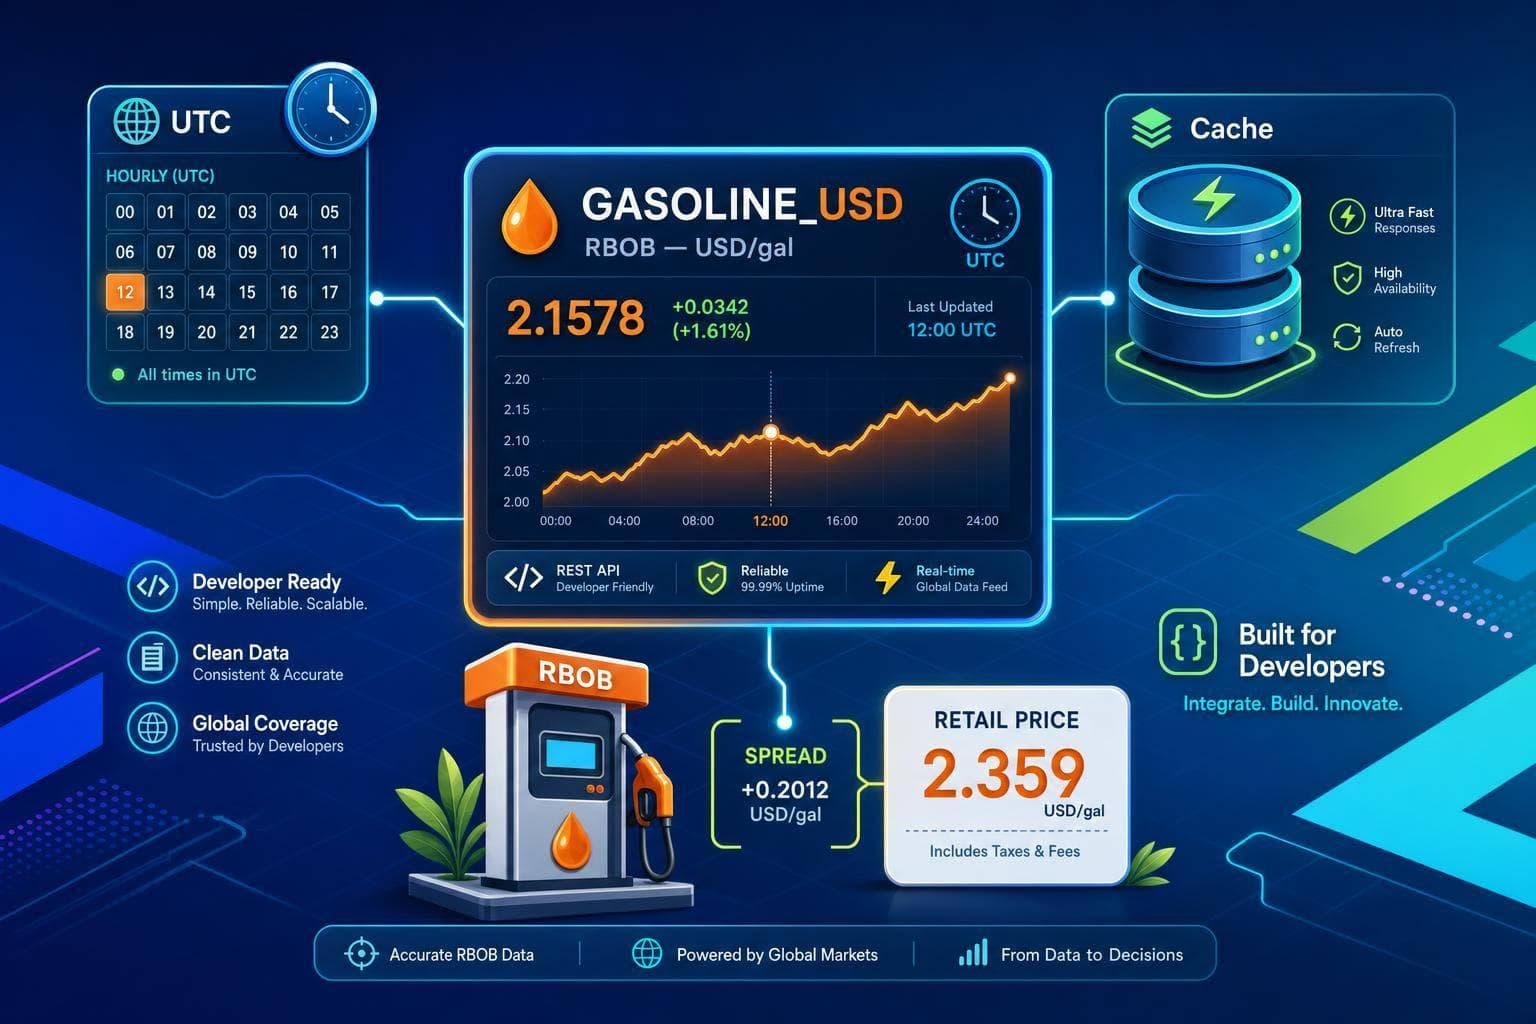
Use RBOB (USD/gal) in apps: GASOLINE_USD feed, UTC timestamps, backend caching, and modeling local retail spreads.
Read More →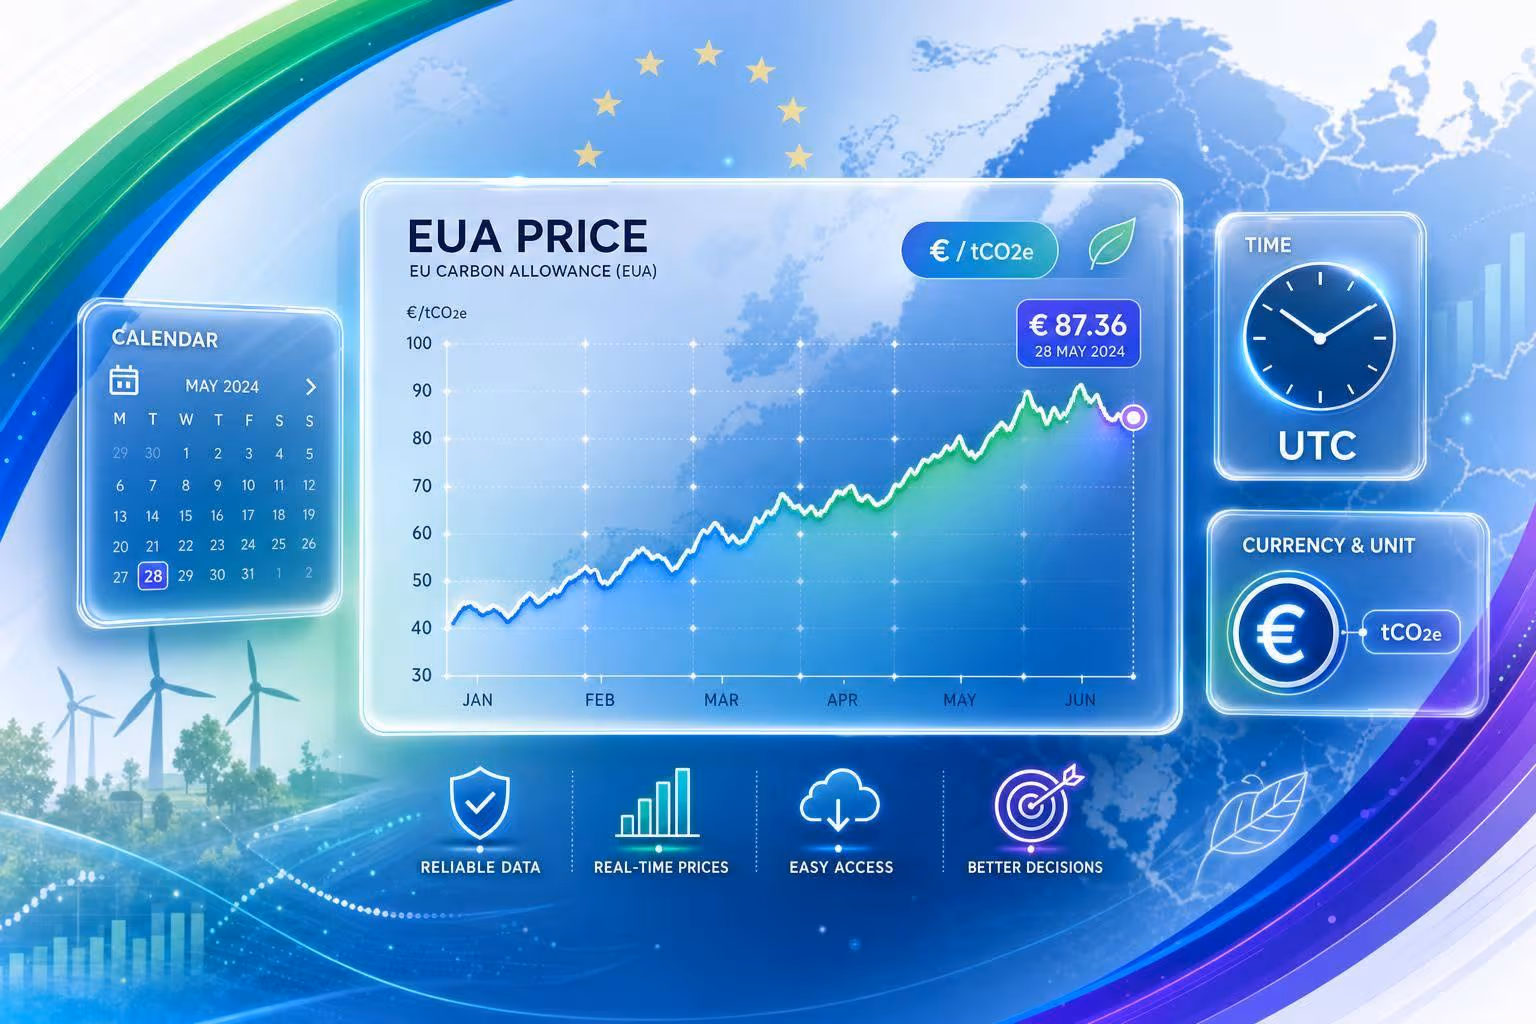
Get and use EUA prices via market viewers, public datasets, or APIs; validate timestamps, currency, and units for accurate carbon cost reporting.
Read More →
Map the right regional jet fuel benchmark, verify the live page, and pull prices via the API with secure token handling and UTC timestamps.
Read More →
Short-term oil volatility can precede U.S. stock volatility in specific regimes; use Z-scores, rolling correlations, and sector checks.
Read More →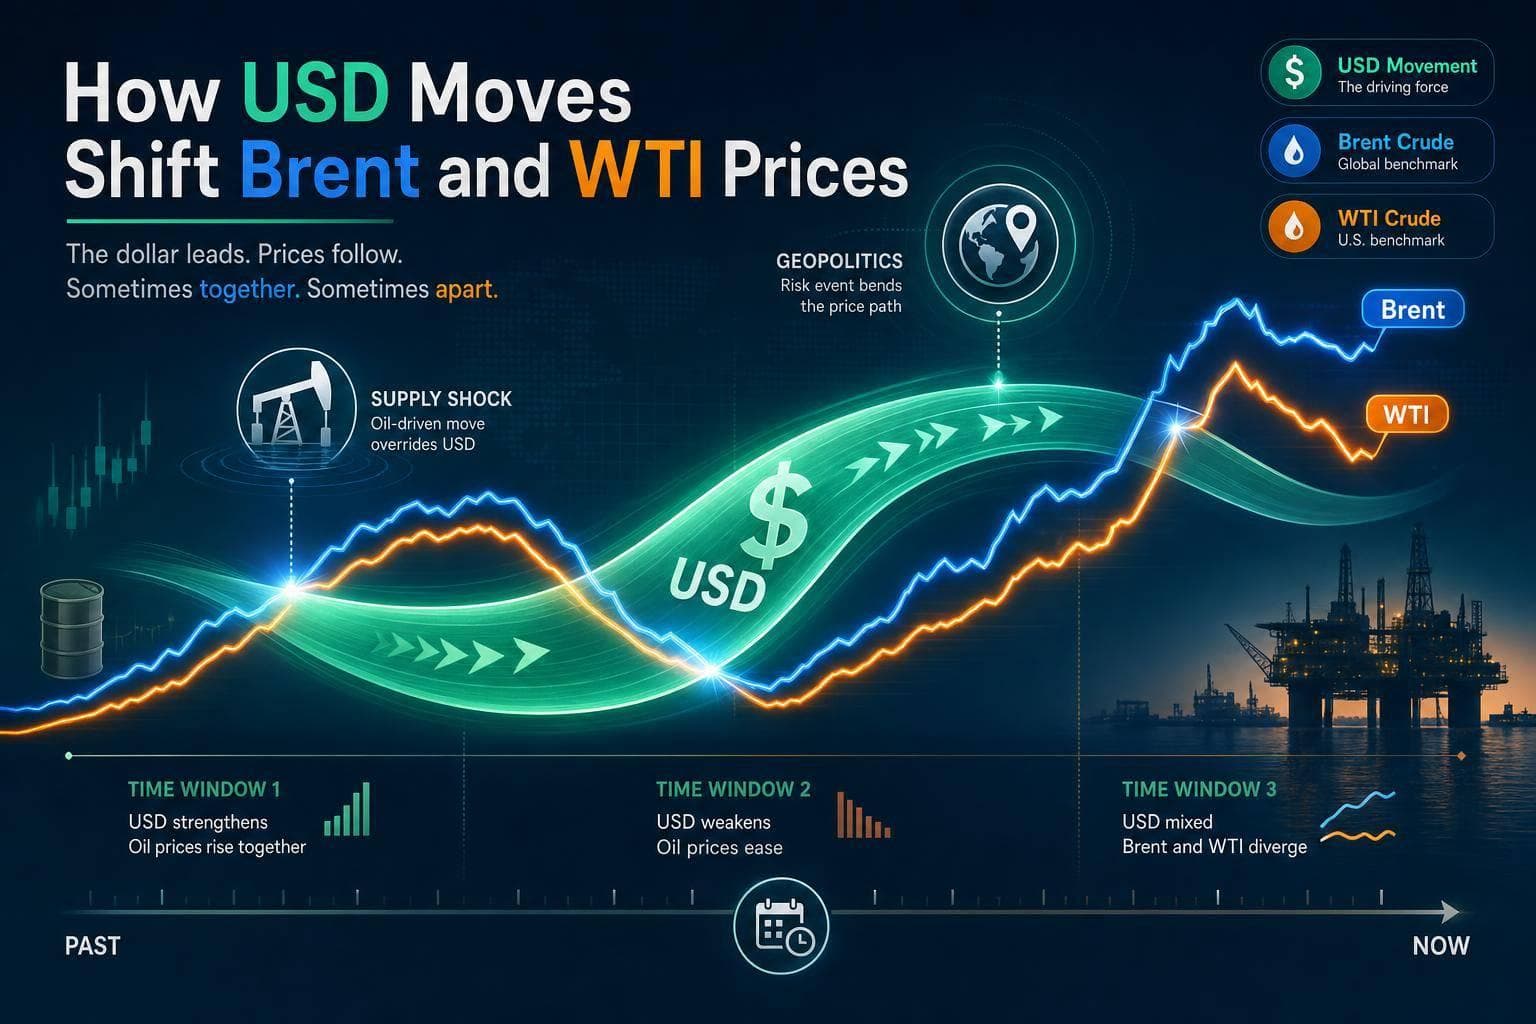
Explains how U.S. dollar moves influence Brent and WTI, how to track rolling correlations, and when supply or geopolitics override FX.
Read More →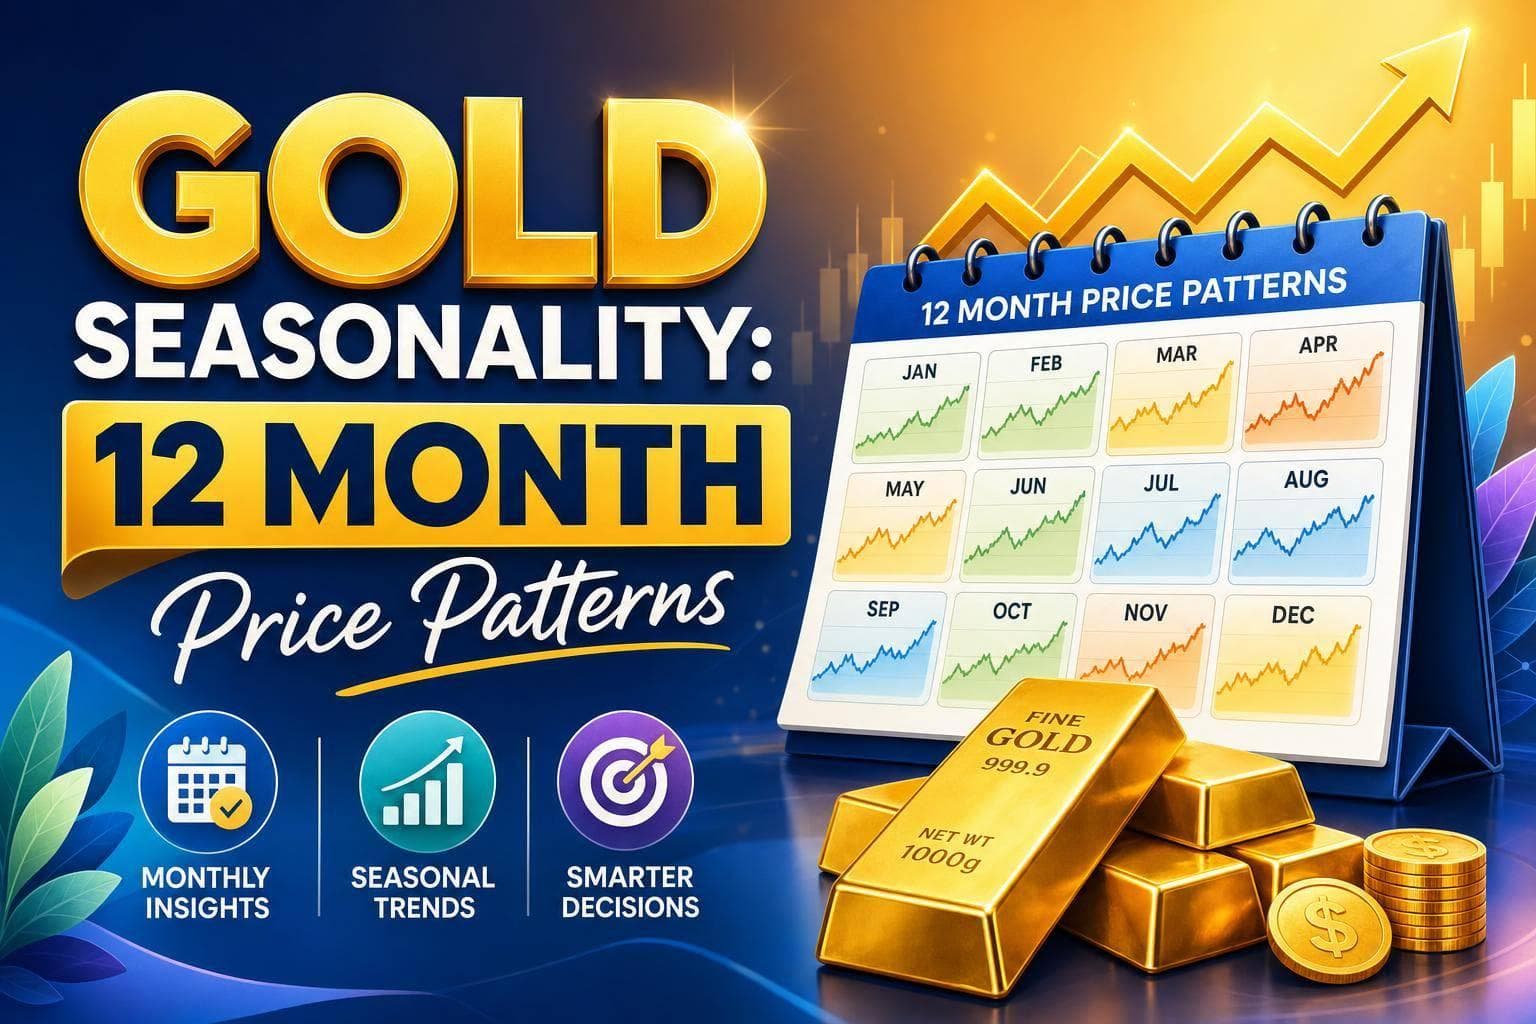
Monthly gold patterns show late-year gains and Jan–Feb peaks, then a spring–summer pullback; use seasonality as a timing filter.
Read More →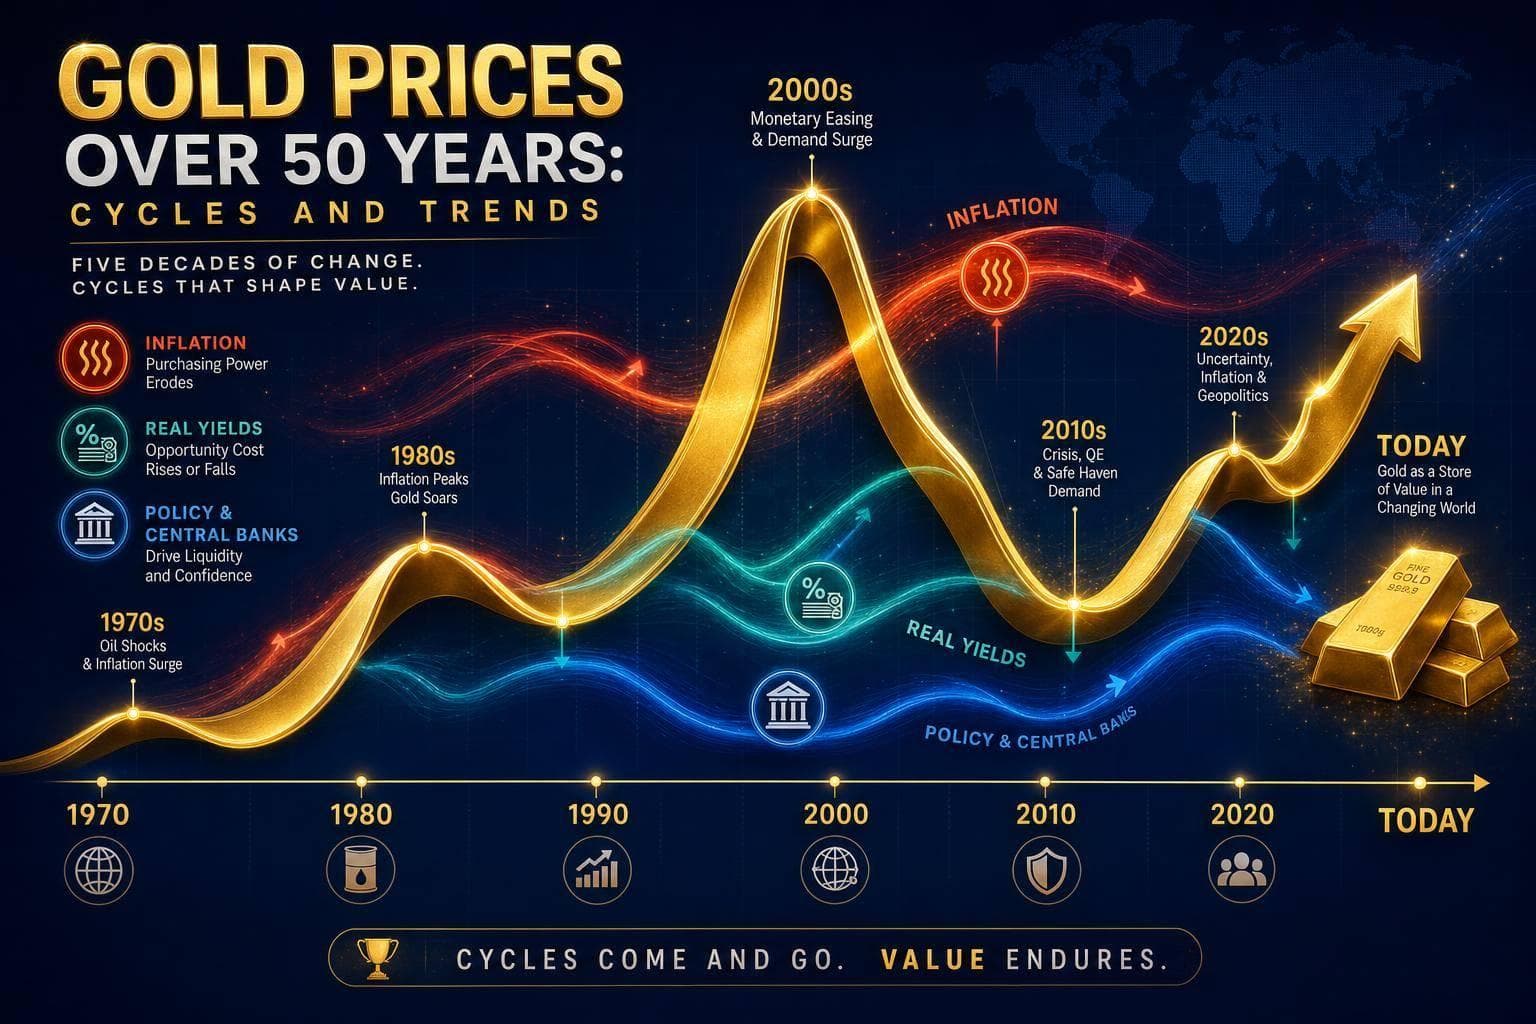
Gold's biggest moves come from shifts in inflation, real yields, and policy—not averages.
Read More →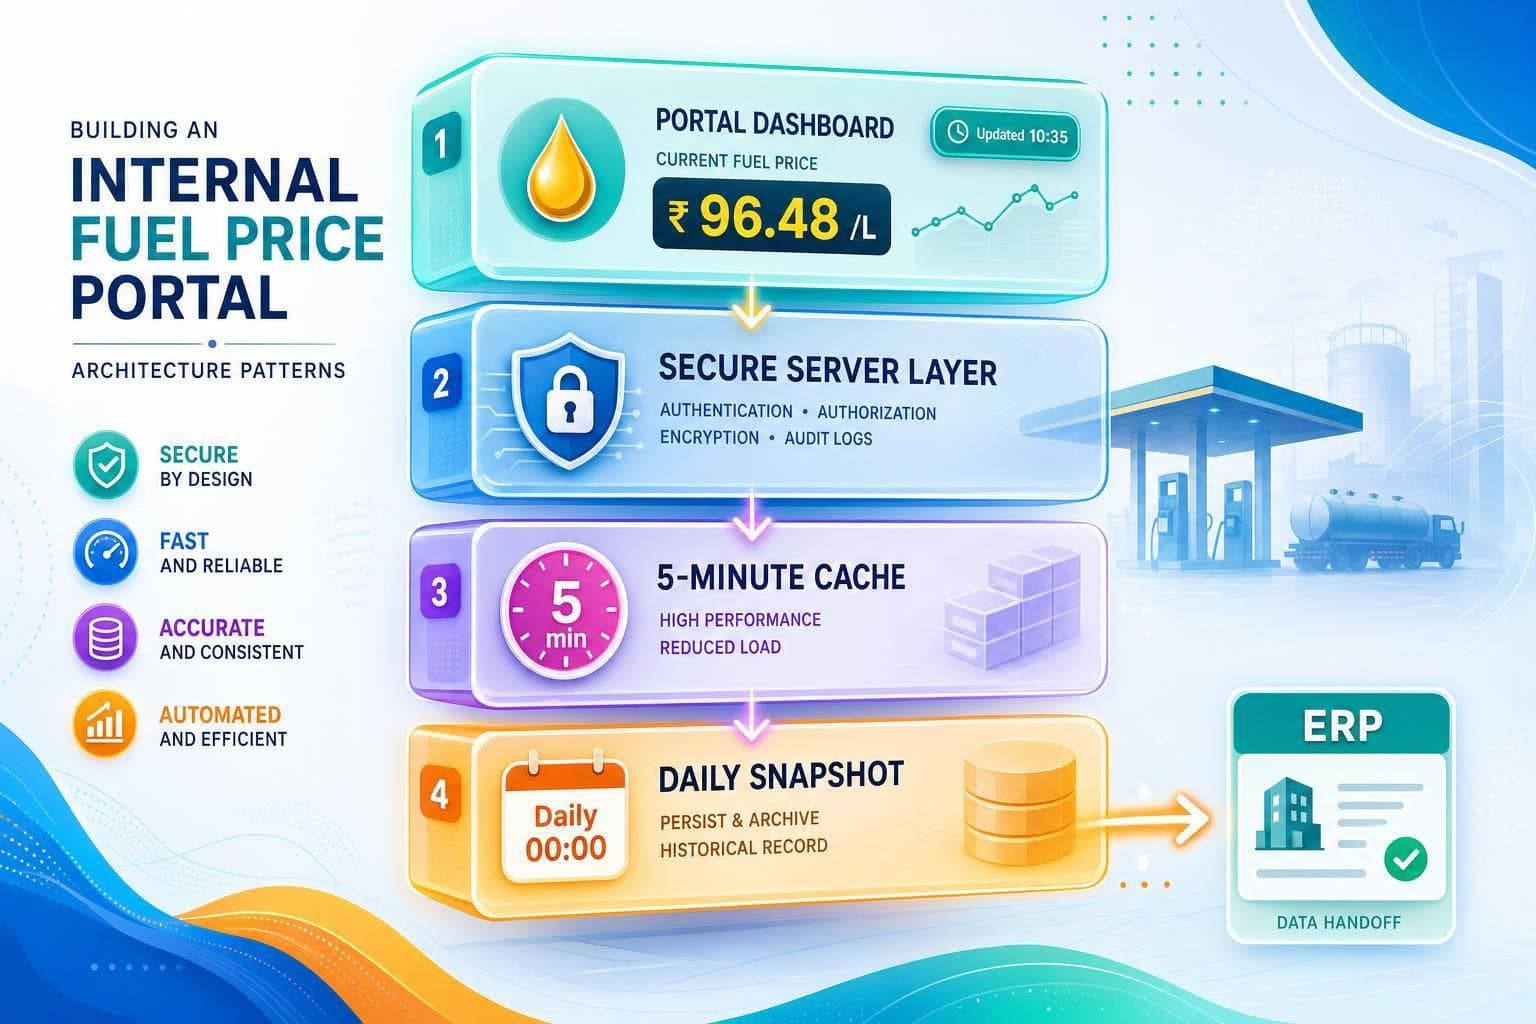
Secure internal fuel-price portal: server-side API calls, 5-minute cache, daily snapshots, clear timestamps, and ERP handoff.
Read More →
Pick coal data by coverage, cadence, and licensing - mixing weekly spot with intraday benchmarks will skew spreads and dashboards.
Read More →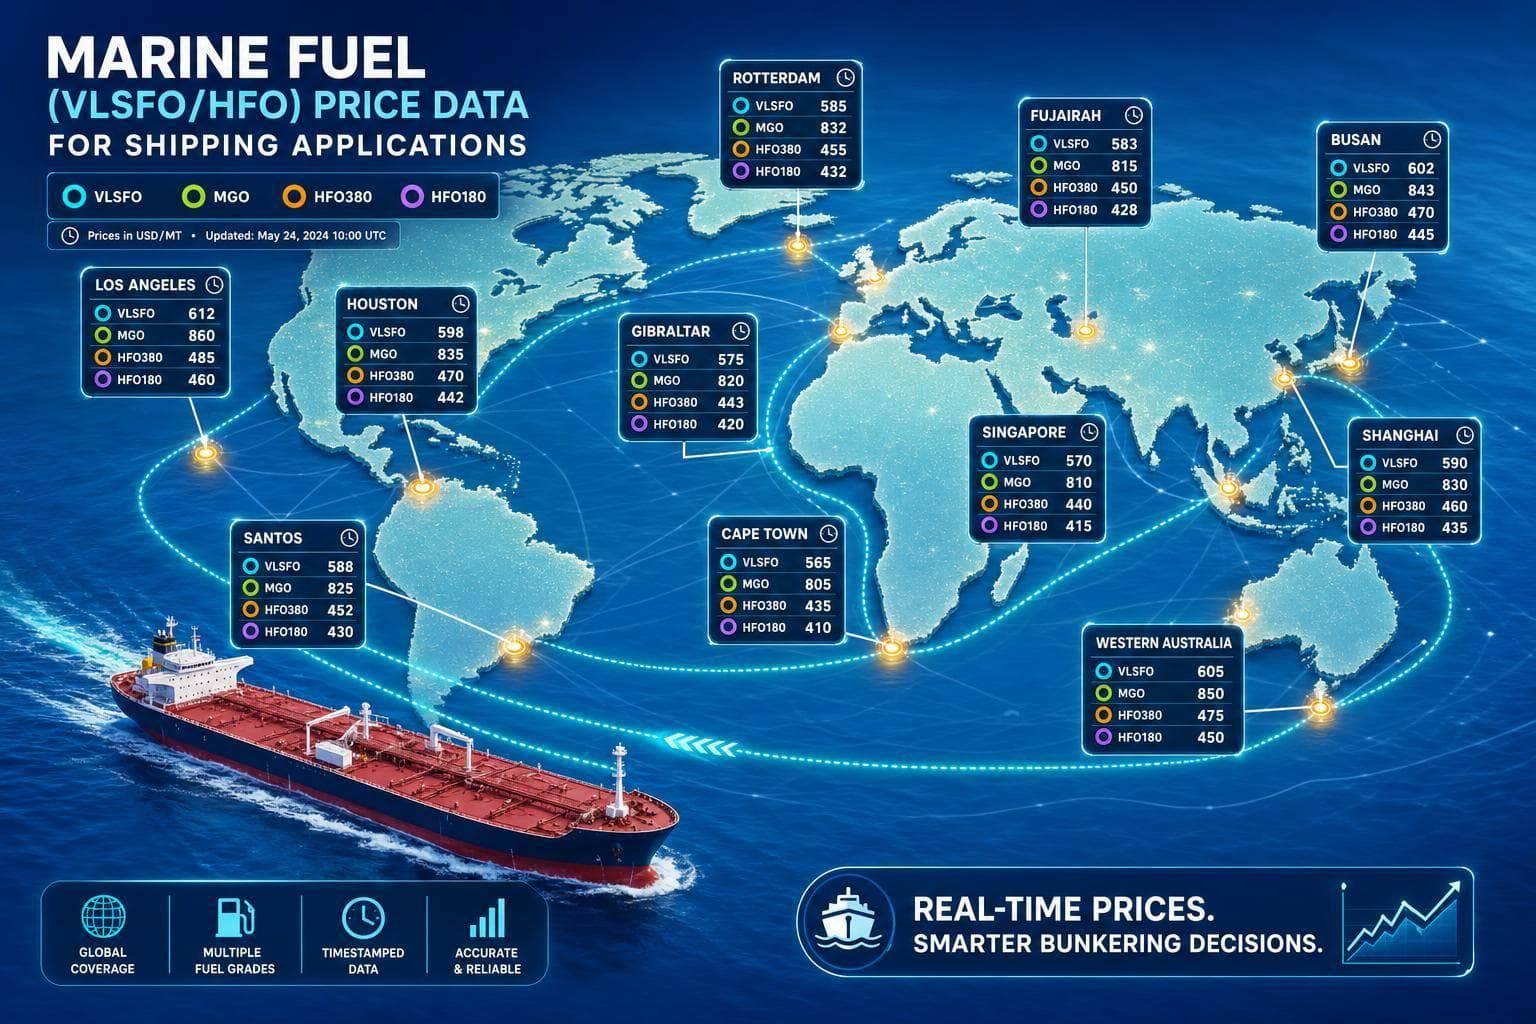
Track VLSFO, MGO, HFO380 and HFO180 as separate port-level USD/MT prices with timestamps for accurate bunker costs.
Read More →
Define an ontology, map and normalize feeds, load append-only price observations, and validate provenance and freshness.
Read More →
Five-step checklist to modularize commodity API ontologies: separate price/unit/currency/time-series, lock URIs, and validate with SHACL.
Read More →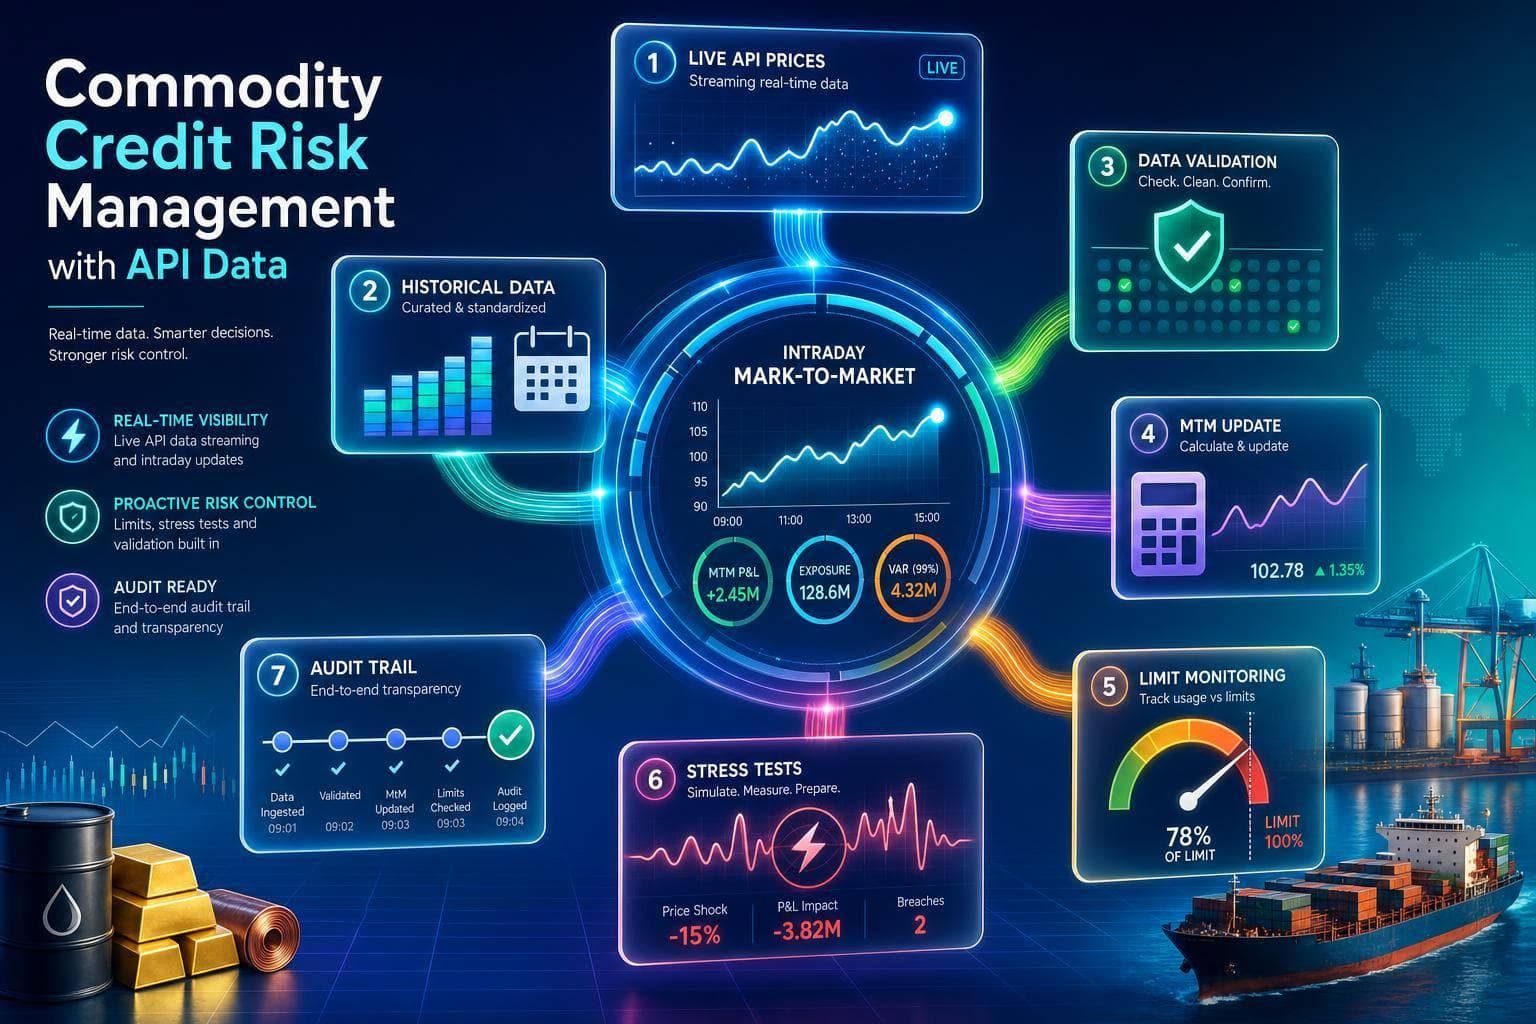
Use live API prices, historical data, and validation to update intraday MtM, monitor limits, run stress tests, and maintain audit trails.
Read More →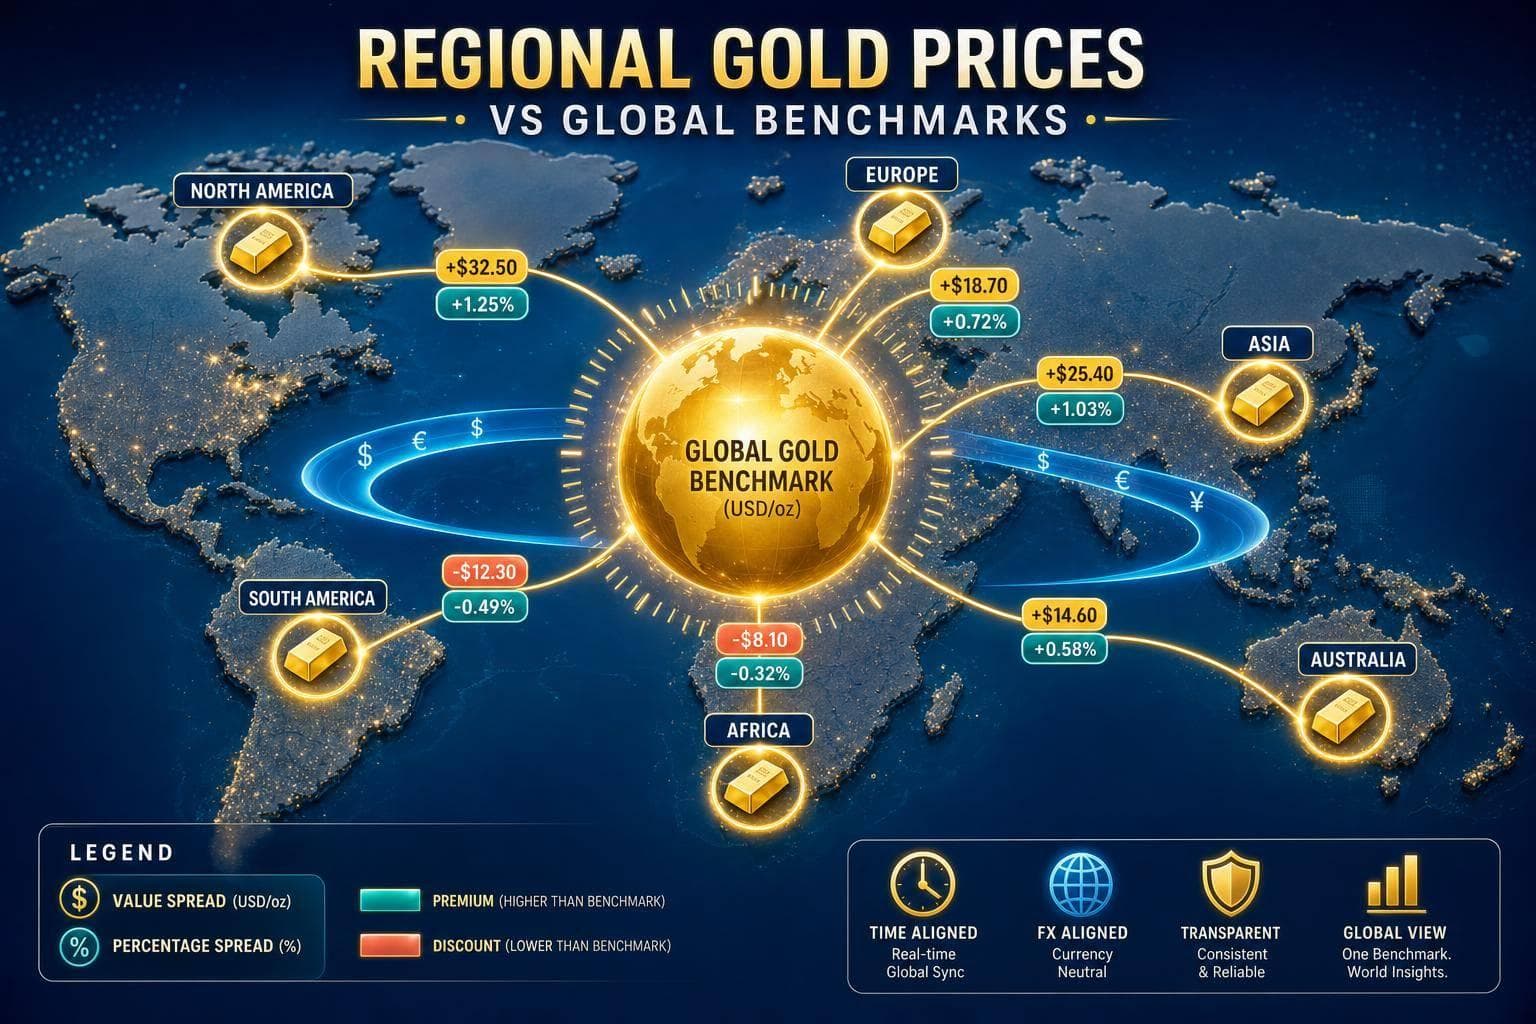
Measure and track local gold premiums vs global benchmarks using dollar and percentage spreads with FX- and time-aligned data.
Read More →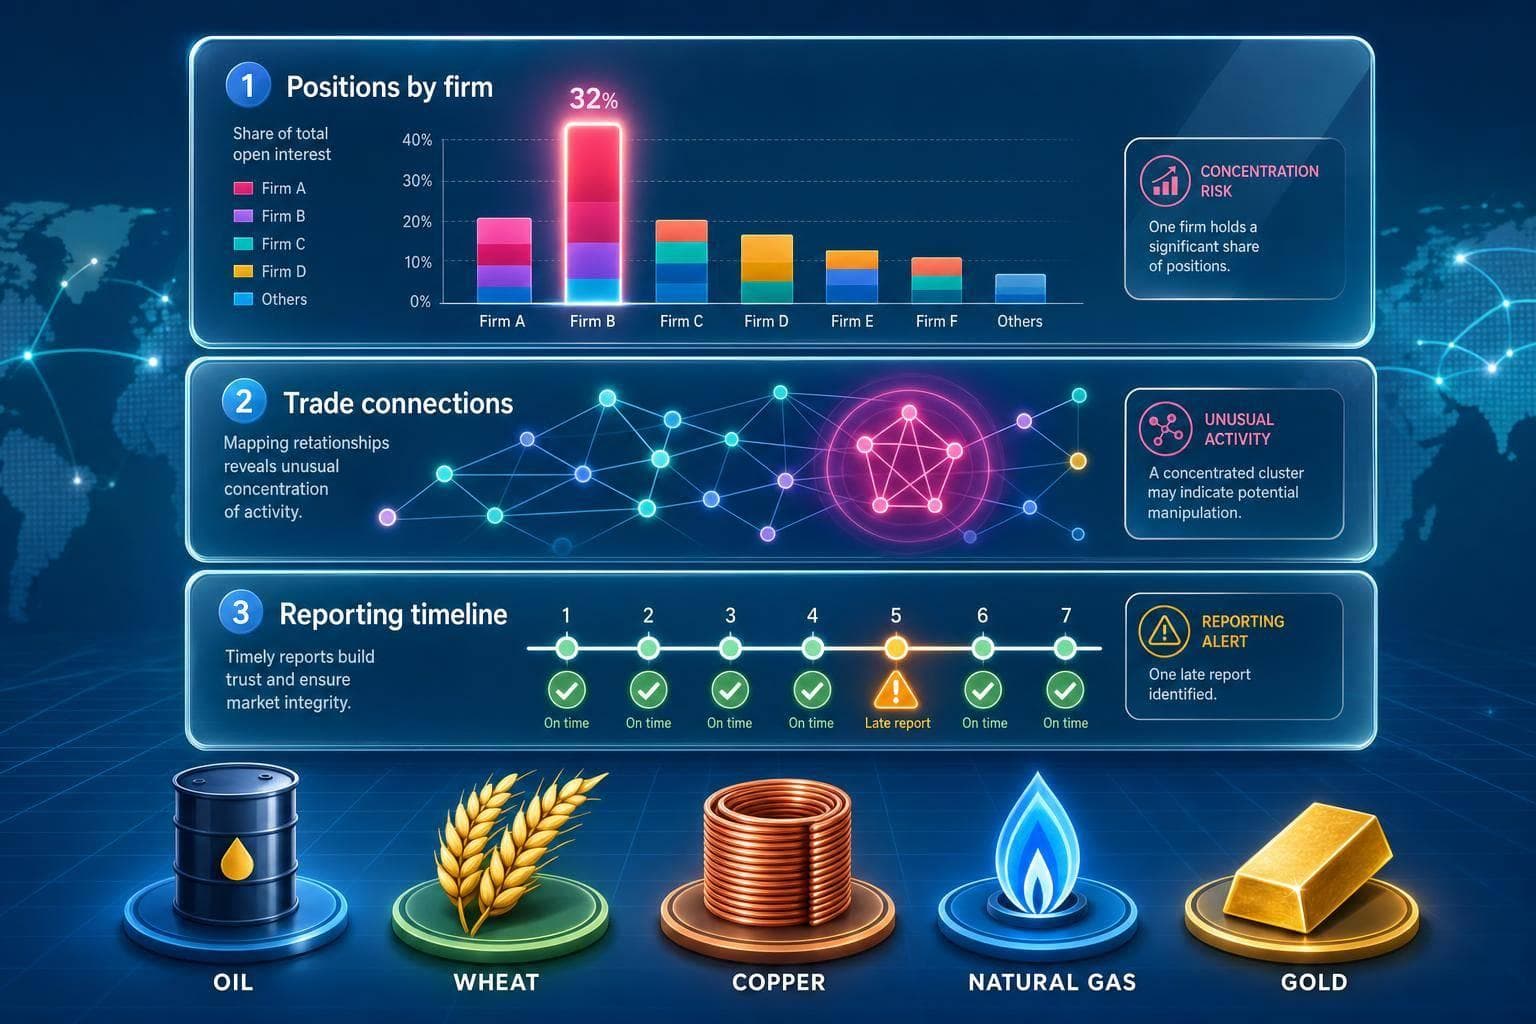
How regulators use trade and position data to spot concentration, manipulation, and reporting errors; why clean, timely reports matter.
Read More →
Ranks 2023 gold consumption to show why China and India lead and which countries buy gold for jewelry versus investment.
Read More →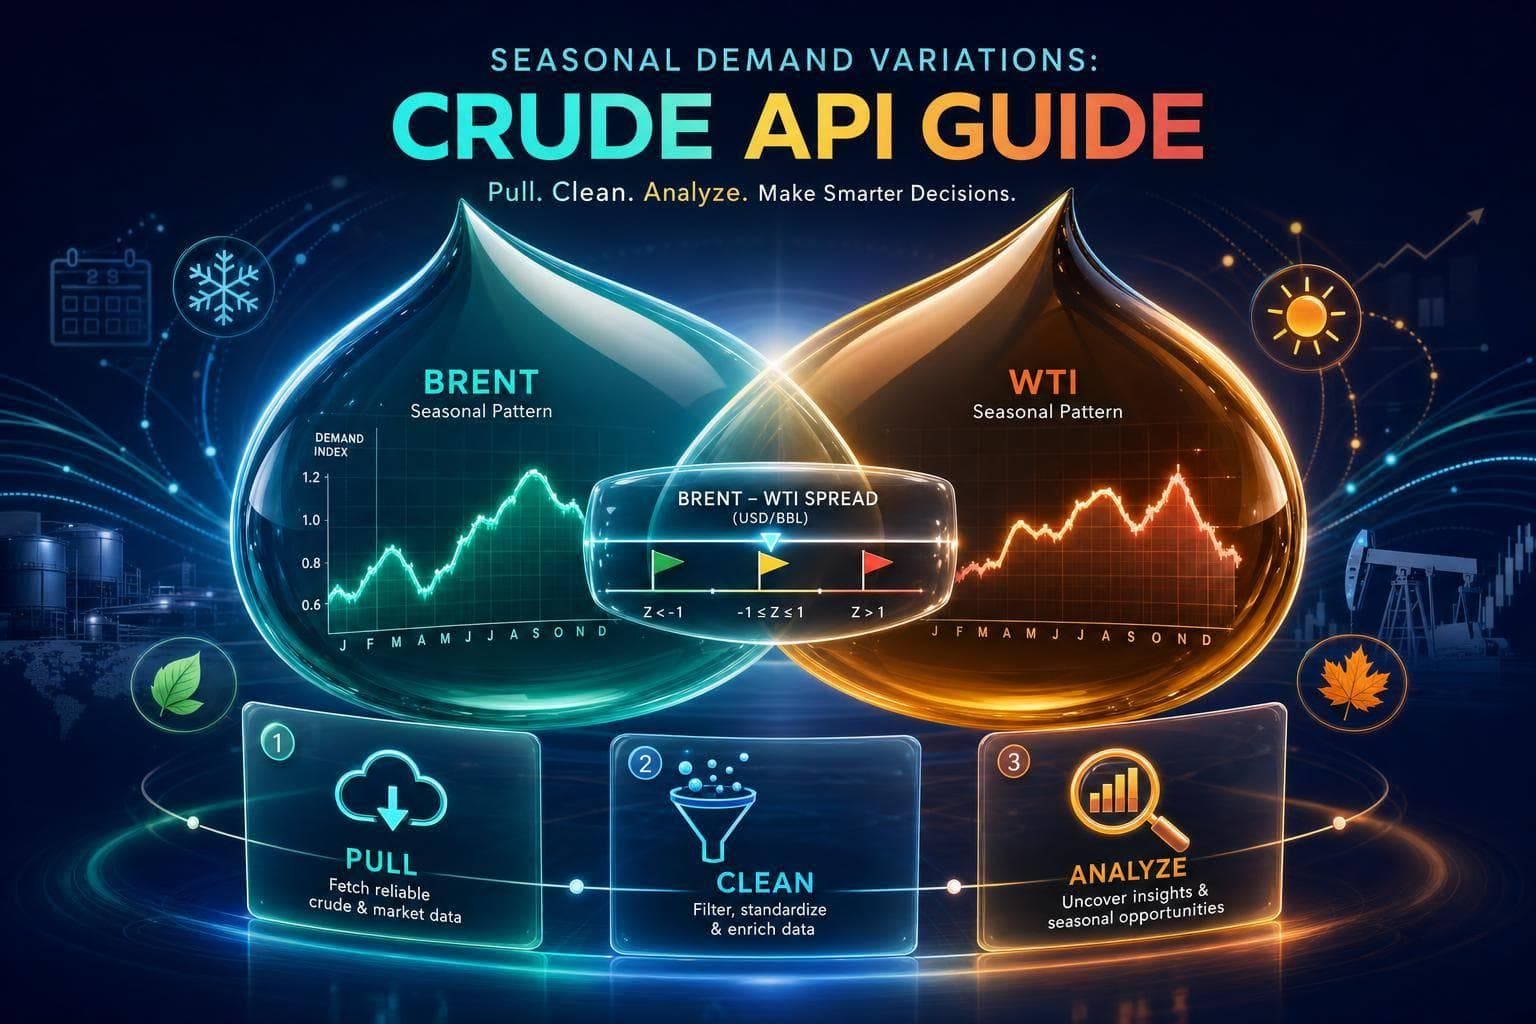
Practical workflow to pull, clean, and analyze Brent and WTI seasonality, spreads, and Z-score flags using OilpriceAPI.
Read More →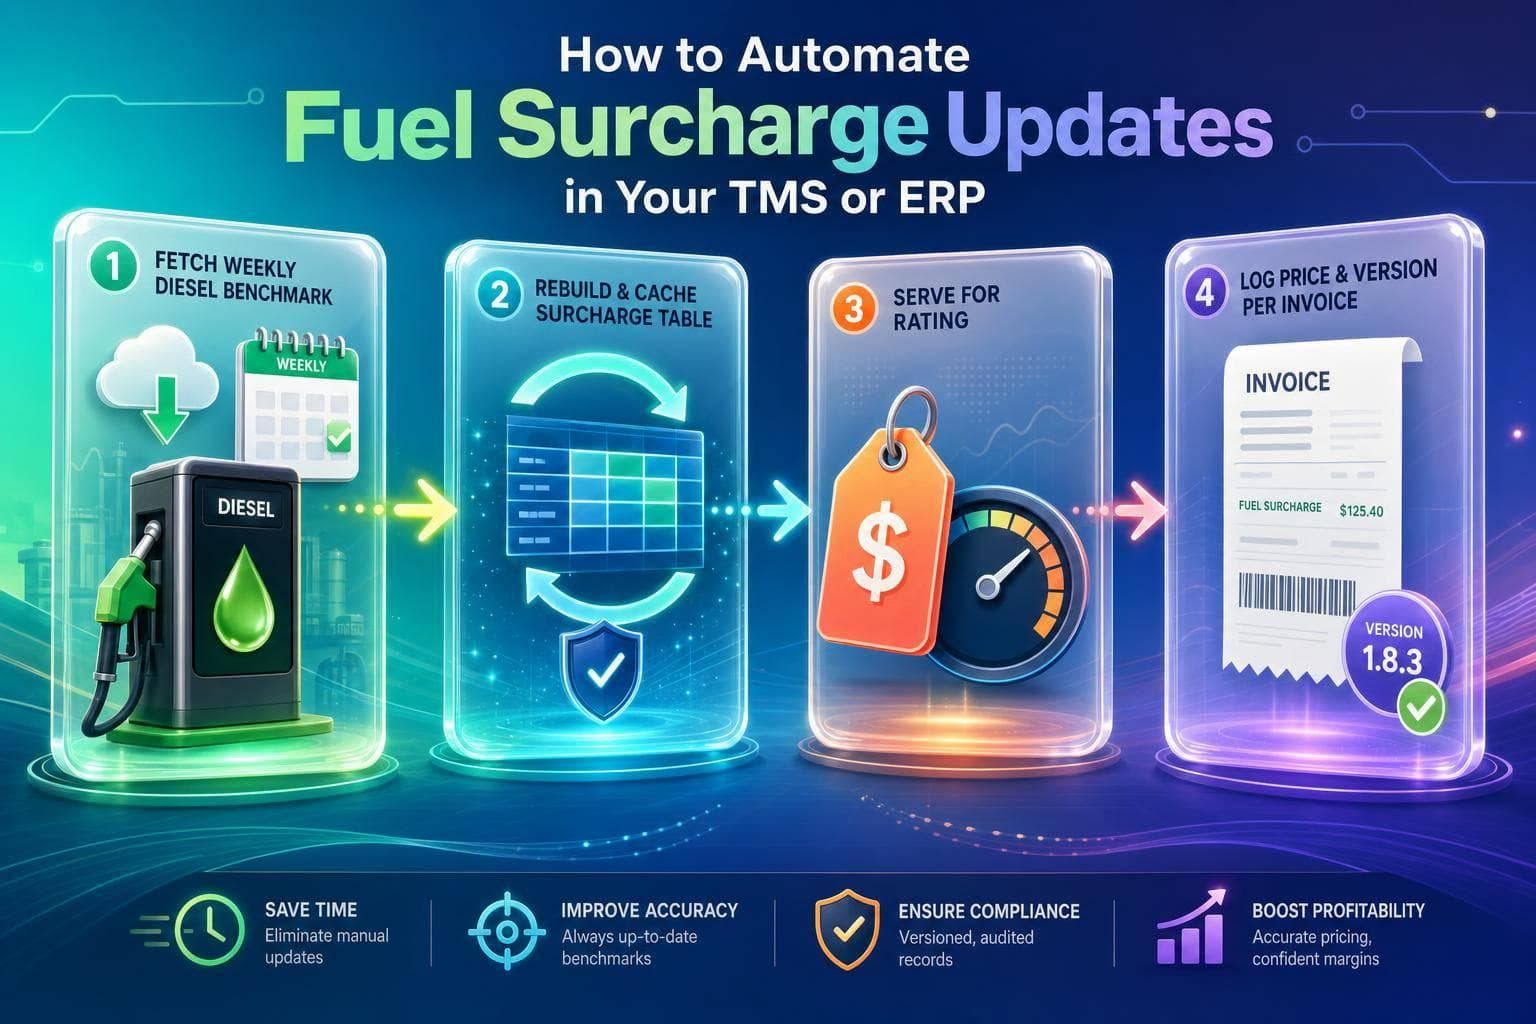
Fetch a weekly diesel benchmark, rebuild and cache a local surcharge table, serve it for rating, and log price/version per invoice.
Read More →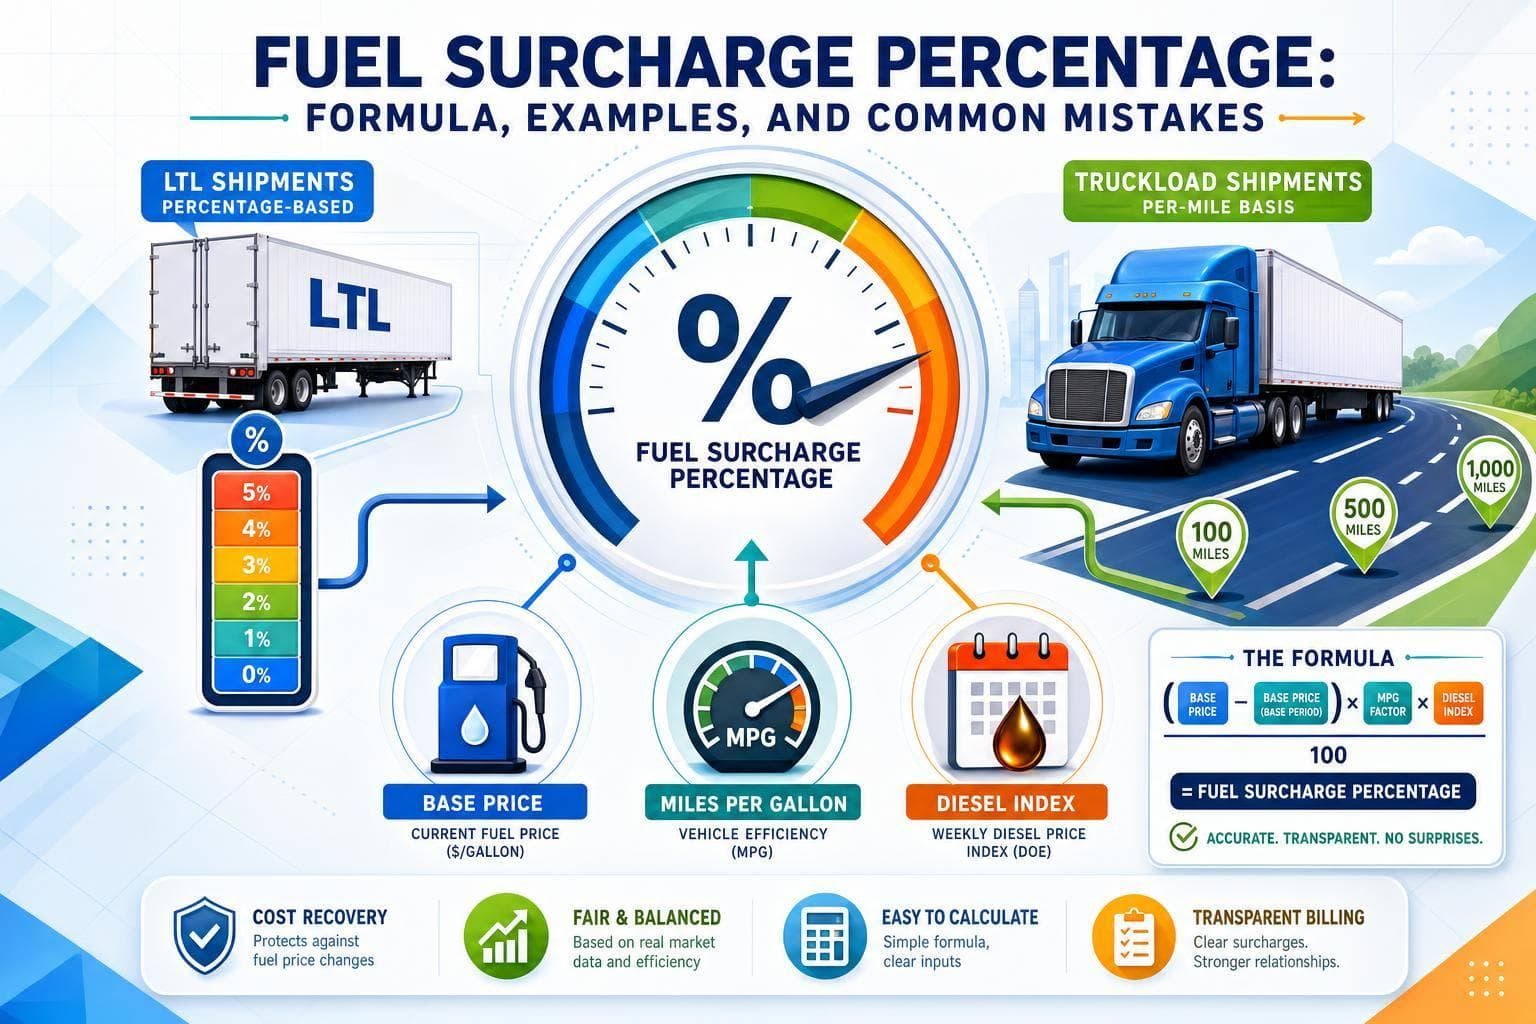
Use percentage-of-linehaul for LTL and per-mile for truckload; keep base price, MPG, and weekly diesel index current to avoid billing errors.
Read More →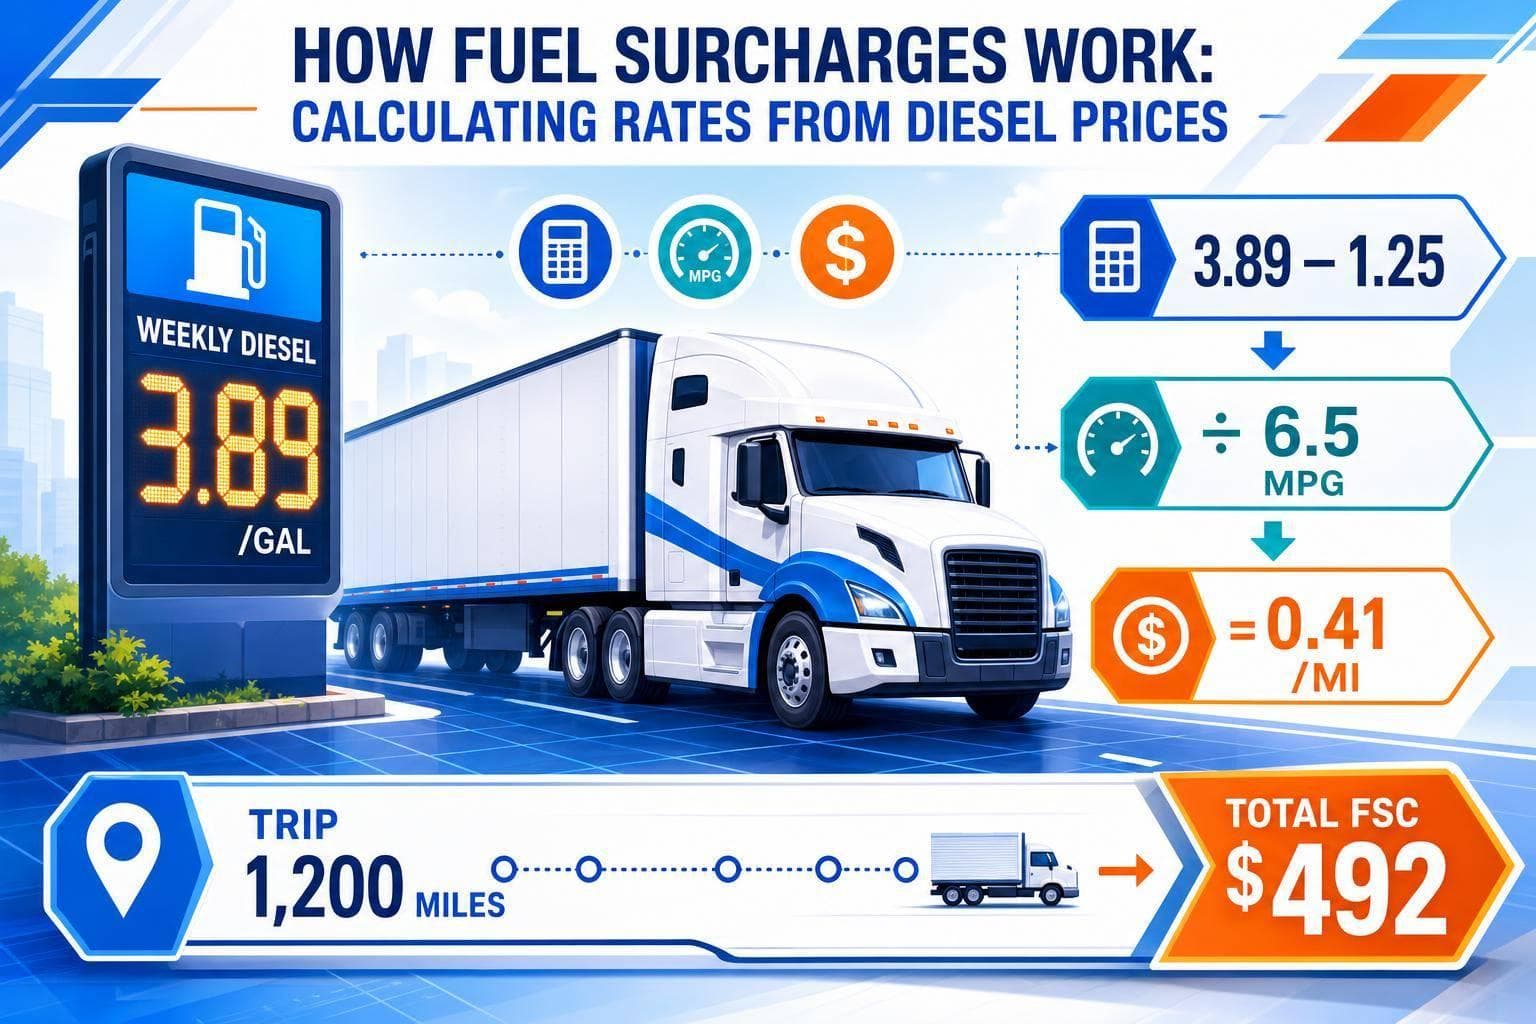
Explains the per‑mile fuel surcharge formula using weekly EIA diesel prices, how to compute total FSC, and ways to automate it.
Read More →
Use Google Sheets as the bridge to feed live oil prices into Looker Studio with scheduled Apps Script and clean long-format data.
Read More →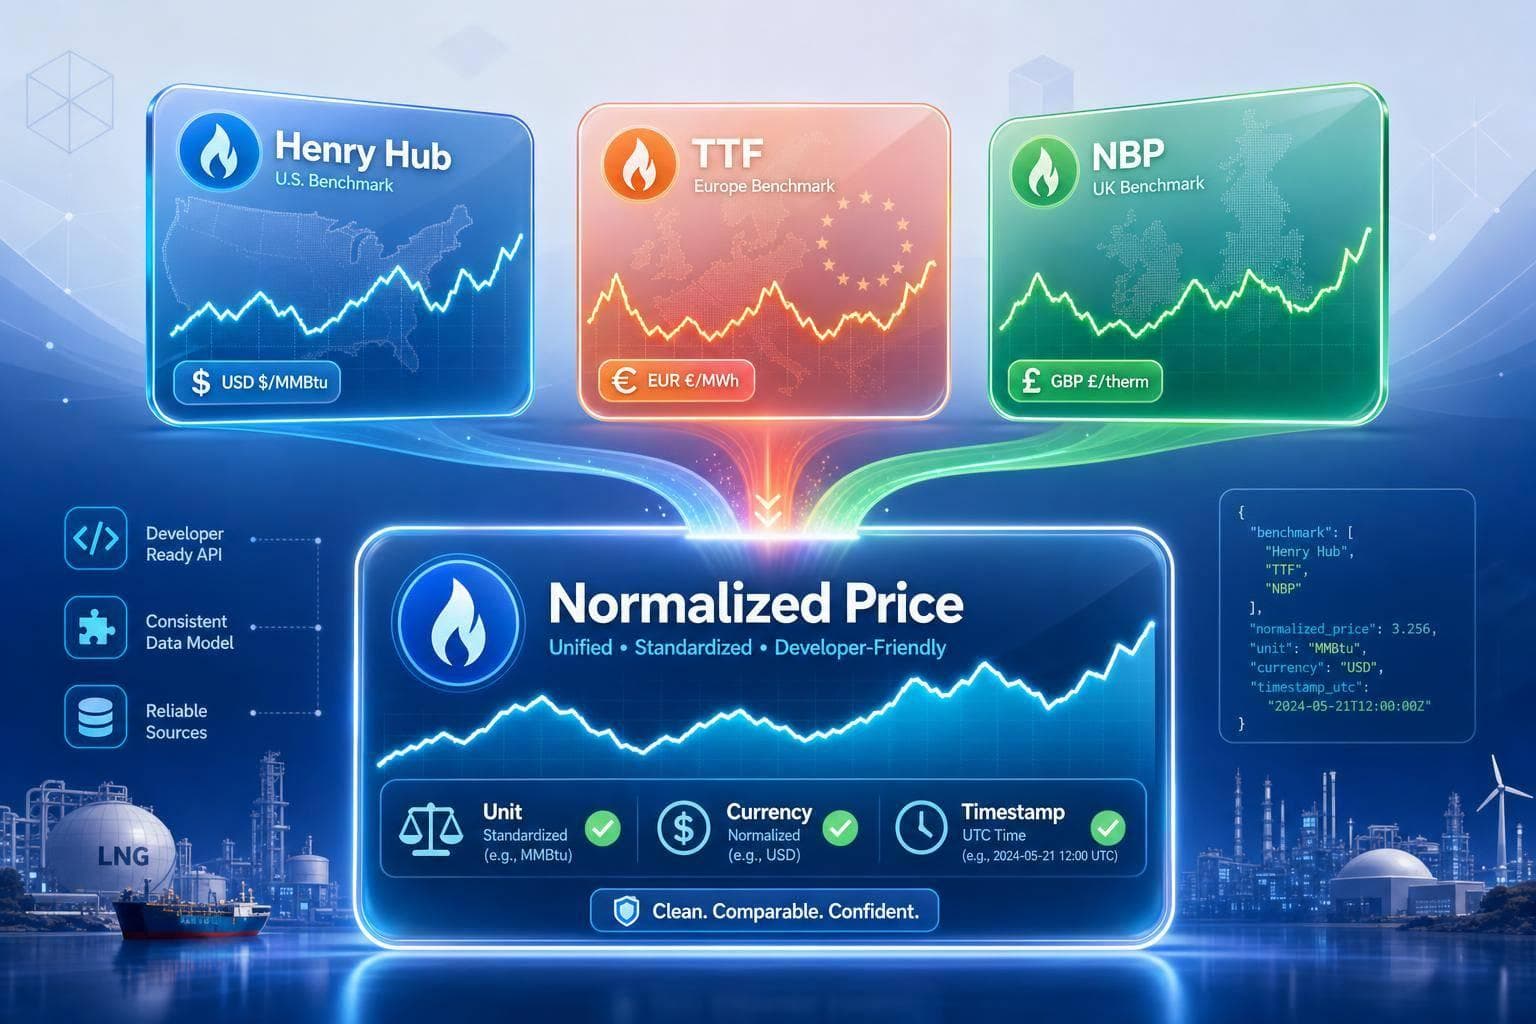
Normalize Henry Hub, TTF and NBP prices with unit and currency conversions, timestamps, and benchmark-aware dashboard rules.
Read More →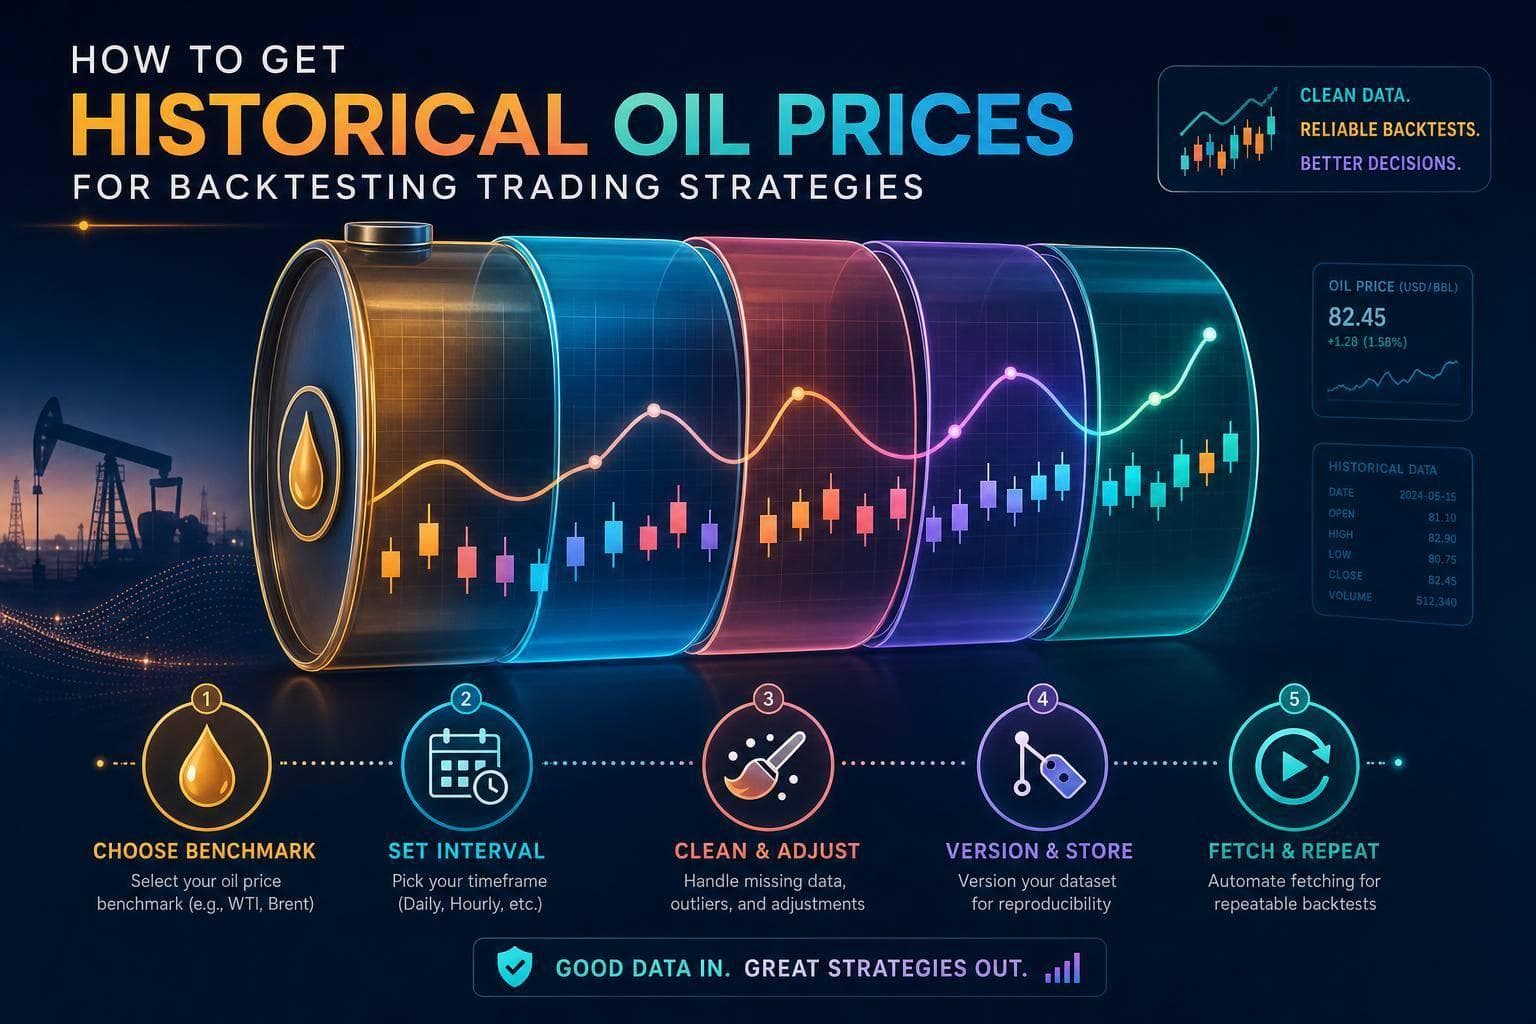
Pick a benchmark and interval, clean and version your oil price data, and fetch repeatable historical series for reliable backtests.
Read More →
Poll for scheduled reports, use webhooks for instant price alerts, or combine both for fast notifications with reconciliation.
Read More →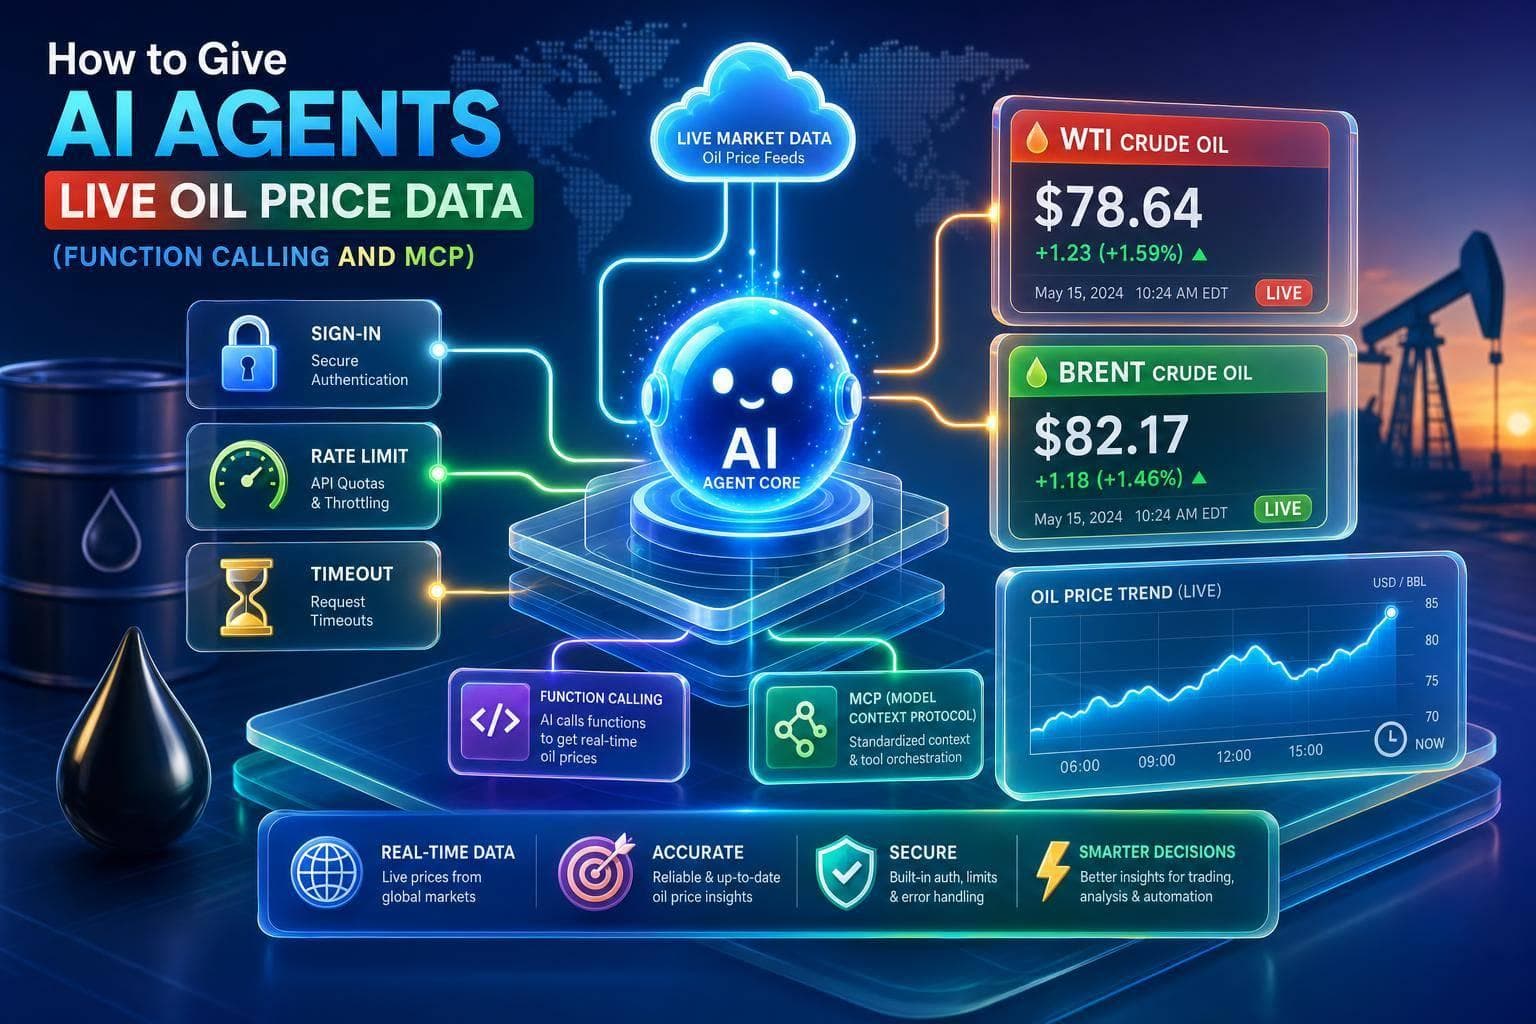
Wire AI agents to live oil price APIs: force tool calls, return timestamped WTI/Brent prices, and handle auth, rate limits, and timeouts.
Read More →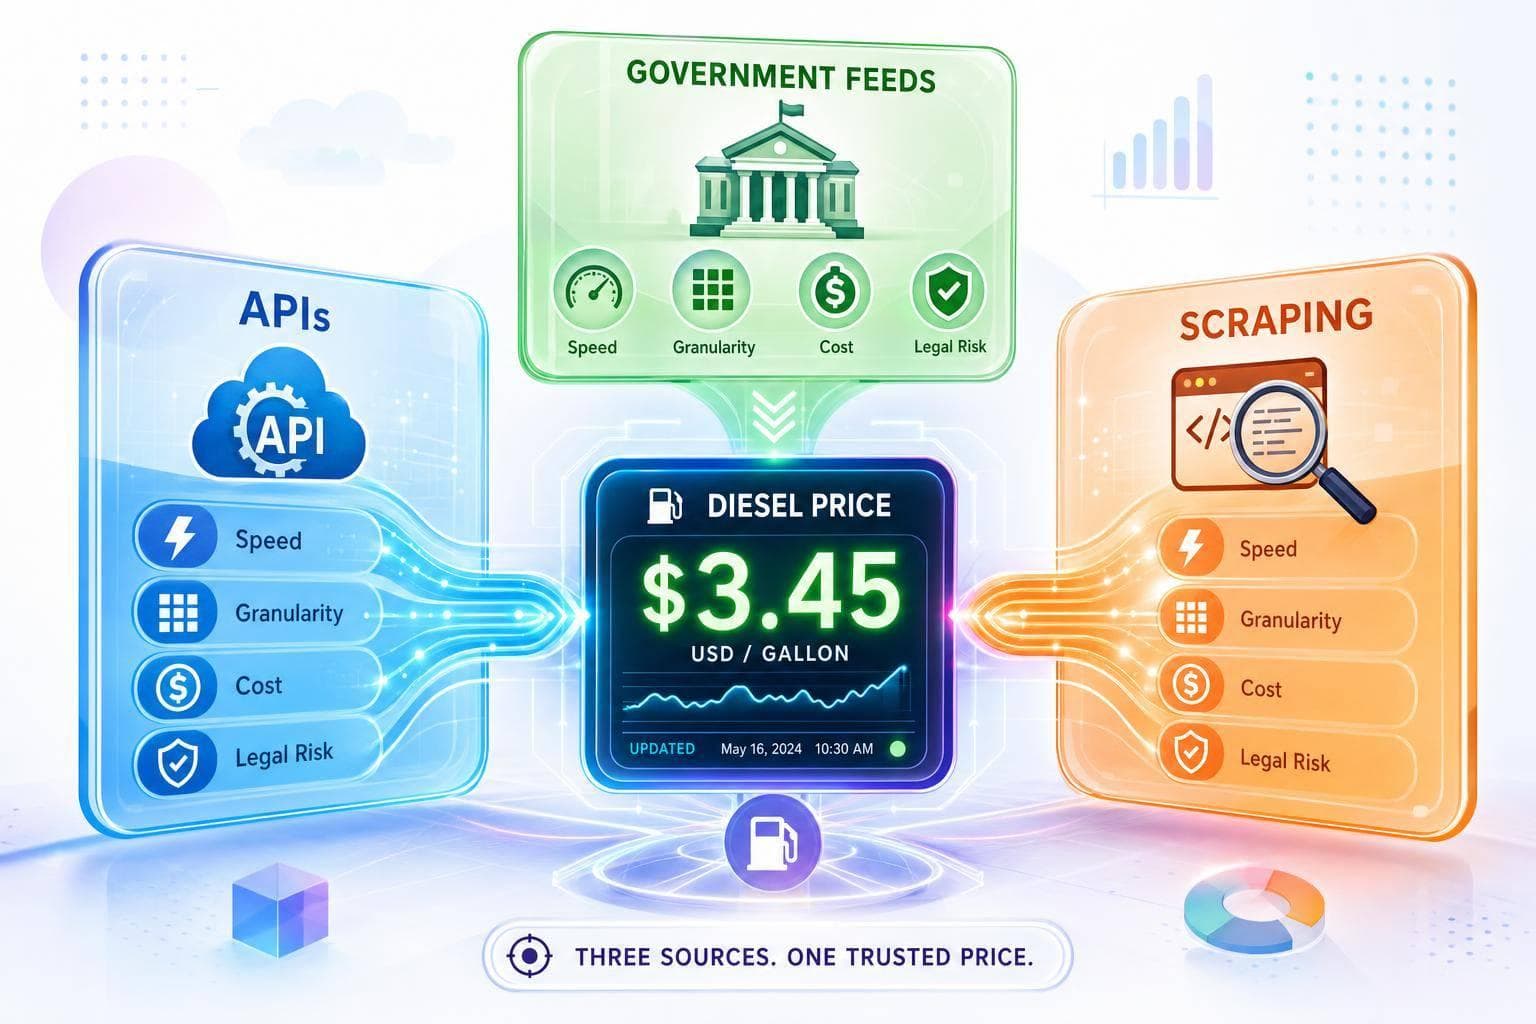
Compare APIs, government diesel feeds, and scraping—tradeoffs in update speed, granularity, cost, and legal risk.
Read More →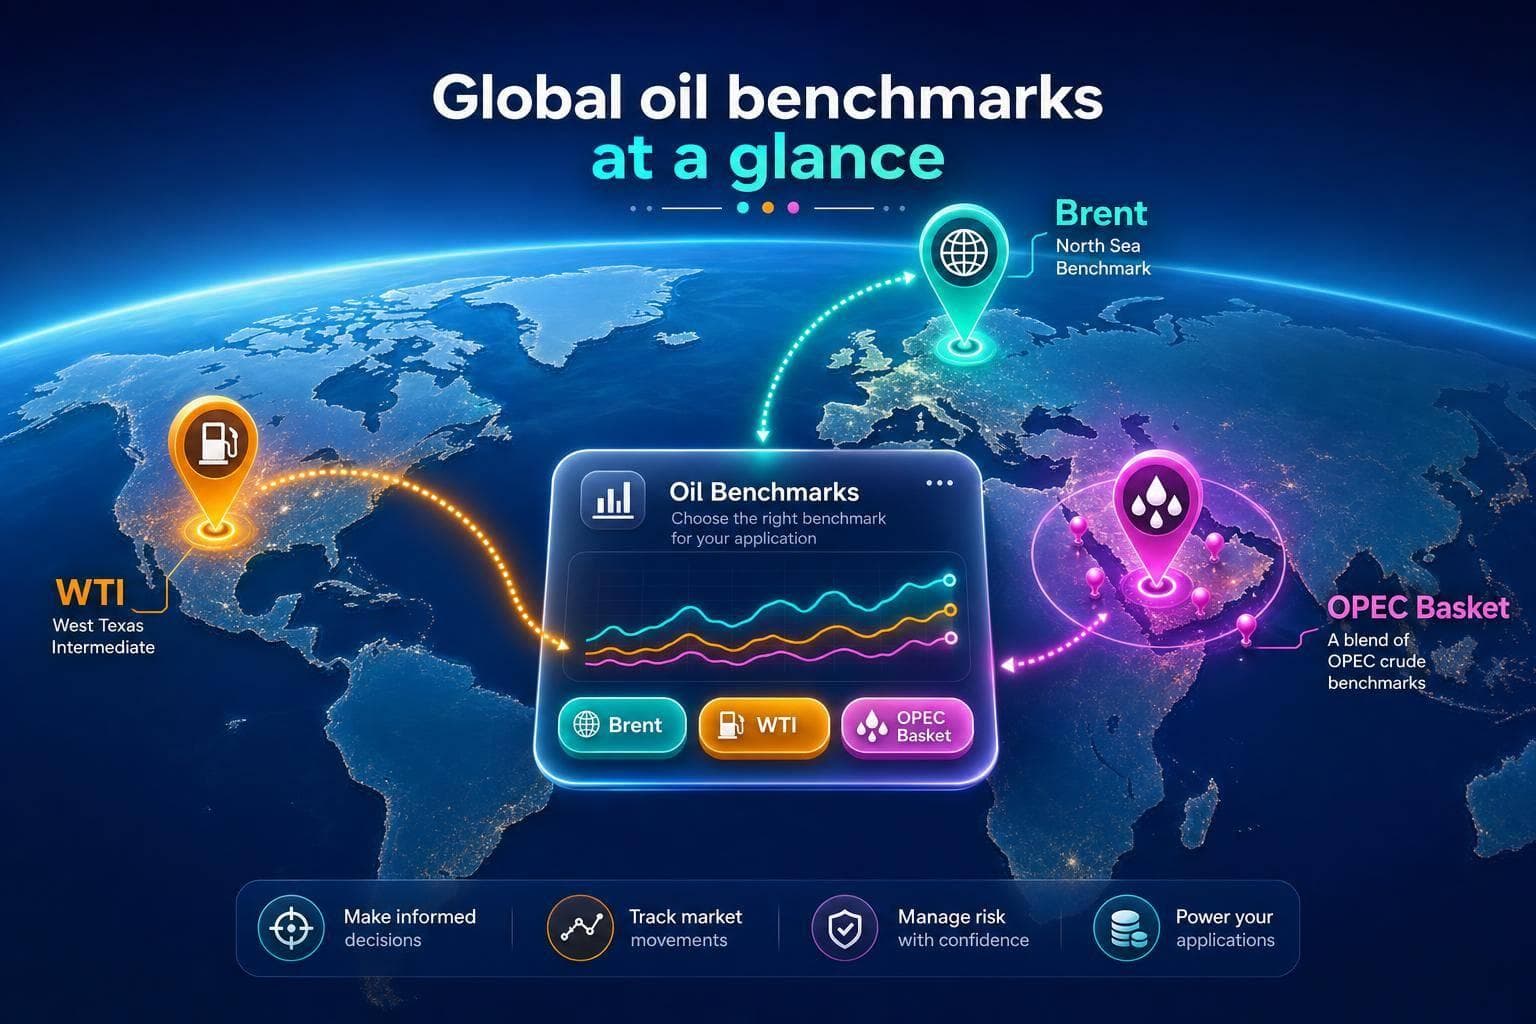
Use Brent for global pricing, WTI for U.S. domestic, and OPEC Basket for supply context; match benchmarks to geography and fuel.
Read More →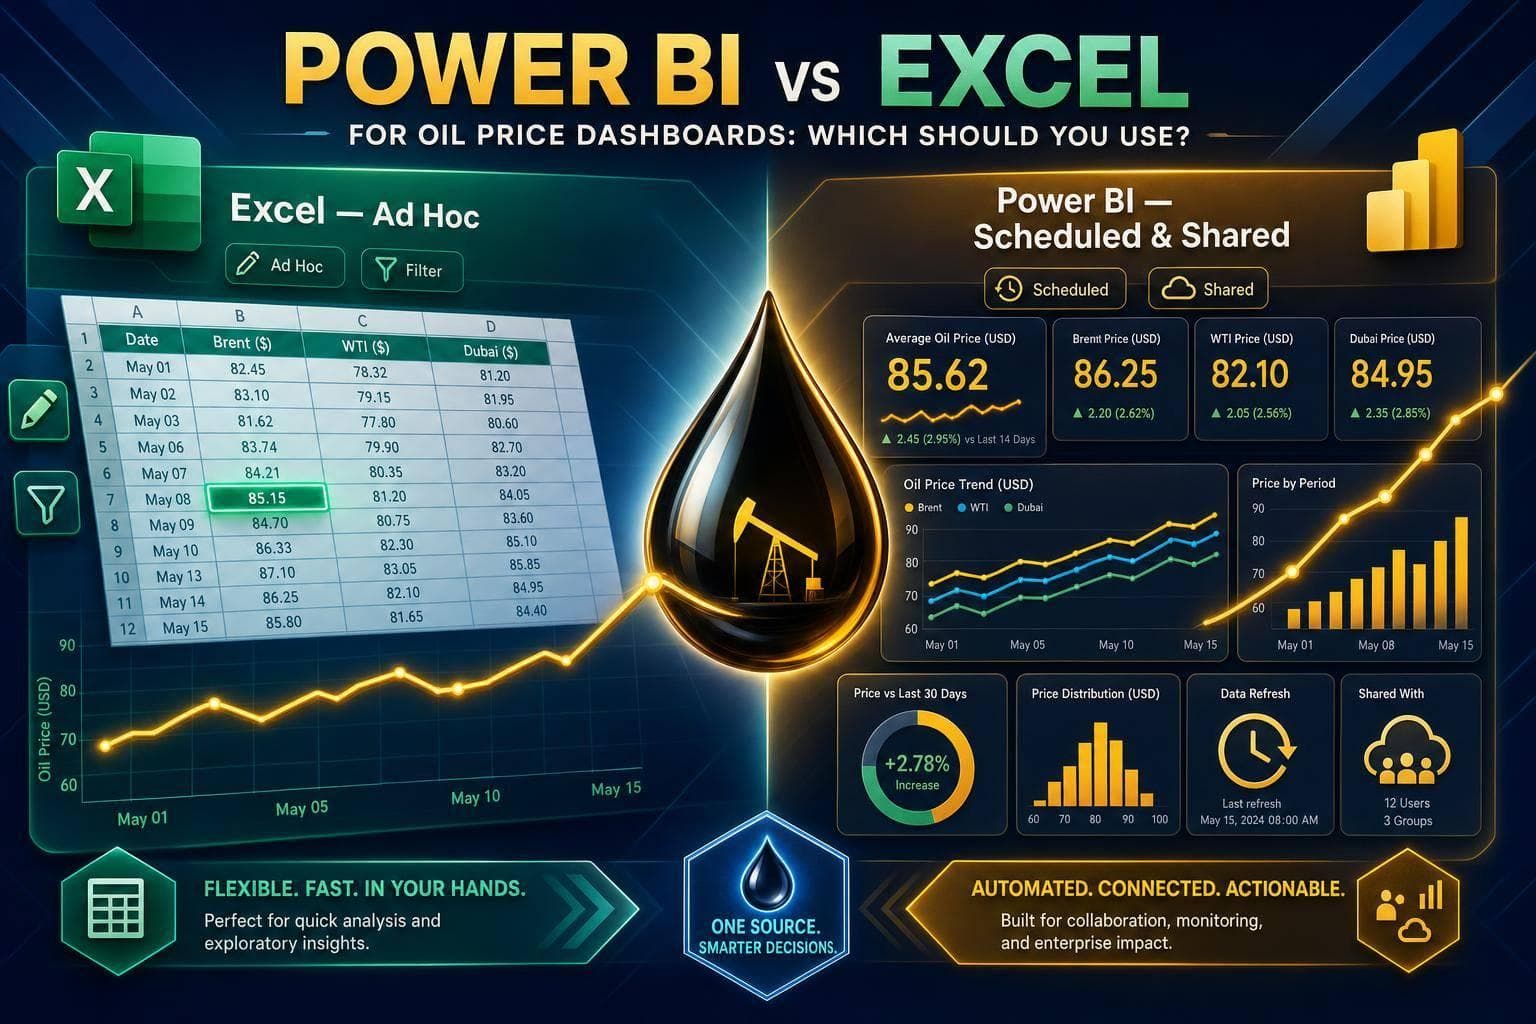
Compare Excel and Power BI for oil price dashboards — Excel for ad hoc, hands-on tracking; Power BI for scheduled, shared reports.
Read More →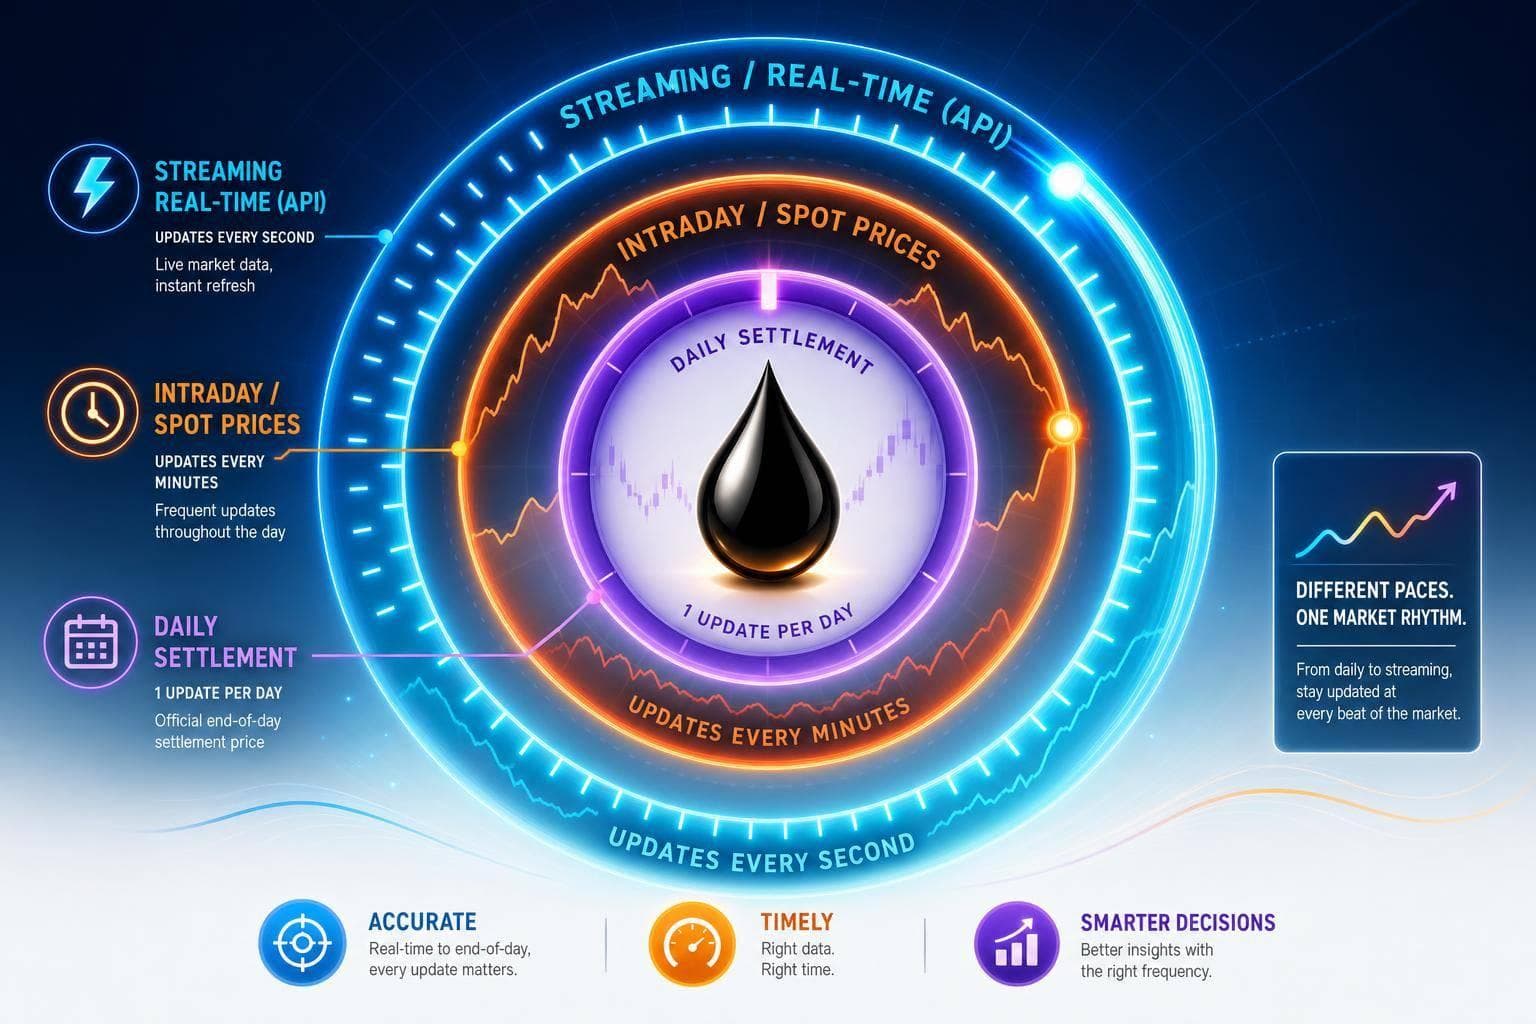
When oil prices update - spot, futures, or settlement - and how to pick API refresh rates from daily to streaming for each use case.
Read More →
Explore latency optimization strategies with streamlined trading systems for ultra-fast execution in dynamic markets.
Read More →
Explore essential legal clauses for API rate limiting policies to protect your service, ensure compliance, and promote fair usage among users.
Read More →
Learn how to create a robust commodity compliance training program that meets regulatory demands and enhances risk management in trading.
Read More →
Explore essential APIs for real-time commodity data integration, enabling smarter decision-making and streamlined workflows in various industries.
Read More →
Explore the challenges and solutions of integrating nanotechnology in gas extraction water treatment, from costs to regulatory hurdles.
Read More →
Explore reliable government sources for historical commodity data, covering energy, agriculture, and minerals, and their practical applications.
Read More →
Sustainability reporting is crucial for commodity traders by 2025, driven by regulations, market demands, and technology advancements.
Read More →
Explore the essential features and top APIs for accessing customizable commodity data in 2025, ensuring traders and analysts stay competitive.
Read More →
Explore how hybrid models enhance commodity price forecasting by combining statistical methods and machine learning for improved accuracy and insights.
Read More →
Explore how centralized and distributed market data systems handle rising data demands, weighing their scalability, costs, and performance.
Read More →
Explore how auto-hedging revolutionizes risk management in commodity trading, offering speed, efficiency, and precision over manual methods.
Read More →
Strengthen your API security with these 10 best practices for authentication, protecting sensitive data from cyber threats.
Read More →
Explore the differences between rate limiting and throttling in API management, essential for ensuring stable performance during traffic spikes.
Read More →
Explore the differences between free and paid commodity data sources, focusing on accuracy, timeliness, and reliability for traders and analysts.
Read More →
Learn how ADX signals can enhance your gold trading strategy by measuring trend strength and providing insights for better decision-making.
Read More →
Explore how Role-Based Access Control (RBAC) enhances security and efficiency when integrated with API gateways for managing user permissions.
Read More →
Explore essential tools and techniques for API gateway logging, focusing on efficiency, security, and compliance in high-traffic environments.
Read More →
Learn how client-side throttling in JSON REST APIs can prevent rate limit violations, enhance user experience, and maintain real-time data reliability.
Read More →
Learn essential practices for effective API audit logging to enhance security, ensure compliance, and improve operational reliability.
Read More →
Explore top APIs for building custom commodity dashboards, featuring real-time data and U.S.-specific insights for various commodities.
Read More →
Explore the top 5 APIs for customized commodity data, offering real-time updates and tailored analytics for various industries.
Read More →
Real-time data APIs are revolutionizing food price monitoring, enabling faster decision-making and enhanced food security responses.
Read More →
Explore how ETRM software simplifies energy trading, enhances risk management, and ensures compliance in volatile markets.
Read More →
Explore how gold's role as a safe-haven asset differed during the 2008 financial crisis and the 2020 pandemic recession, revealing key insights for investors.
Read More →
Commodity price volatility significantly influences counterparty credit risk, affecting contract values and liquidity across financial markets.
Read More →
Explore the potential of Microbial Enhanced Gas Recovery as a cost-effective and environmentally friendly alternative to traditional gas extraction methods.
Read More →
Explore the key differences between inverse and leveraged ETFs, their risks, uses, and why they are best suited for short-term strategies.
Read More →
Explore how political stability influences commodity prices, revealing key metrics and tools for informed market decisions.
Read More →
Explore how Bayesian models enhance commodity price forecasting through probabilistic predictions and real-time data integration.
Read More →
Understanding gold price seasonality can enhance investment strategies, revealing optimal buying and selling periods throughout the year.
Read More →
Explore how automation is revolutionizing natural gas extraction, enhancing efficiency, safety, and environmental sustainability in the industry.
Read More →
Explore the differences between RMSE and MAE metrics for evaluating prediction models, and learn how to choose the right one for your needs.
Read More →
Learn how to integrate Brent Crude pricing into BI tools with key API features, benefits, and evaluation factors for informed decision-making.
Read More →
Explore how AI enhances seasonal inventory forecasting with real-time data and advanced models to optimize supply and meet consumer demand.
Read More →
Learn how to accurately calculate the Average Directional Index (ADX) for gold trading and improve your market analysis with reliable data.
Read More →
Explore how WebSocket technology revolutionizes real-time data delivery in commodity markets, enhancing speed, efficiency, and decision-making.
Read More →
Explore how real-time data and advanced technologies enhance reservoir management, improving decision-making and operational efficiency.
Read More →
Understanding commodity price cycles is essential for investors navigating the complexities of boom, bust, and recovery phases in volatile markets.
Read More →
Real-time alerts offer businesses a competitive edge in commodity markets by providing instant updates, improving accuracy, and reducing costs.
Read More →
Explore the contrasting methane emission regulations between the US and EU, and their impact on natural gas markets and international trade.
Read More →
ASEAN's gold demand significantly influences global prices through cultural practices, economic shifts, and trading dynamics across markets.
Read More →
Explore the top nano-sensors revolutionizing reservoir characterization, offering precise insights into subsurface conditions and enhancing recovery strategies.
Read More →
Explore leading cloud platforms that deliver low-latency data feeds essential for real-time commodity trading and decision-making.
Read More →
Explore how commodity APIs streamline trading systems by providing real-time data, enhancing integration, and ensuring compliance for better decision-making.
Read More →
Explore effective throttling strategies for APIs, ensuring stability, compliance, and optimal performance under heavy traffic conditions.
Read More →
Explore how commodity APIs provide real-time data for effective decision-making in volatile markets, enhancing risk management and procurement strategies.
Read More →
Explore effective pagination strategies for REST APIs handling large commodity datasets, ensuring optimal performance and user experience.
Read More →
Learn how to effectively set ADX indicators for gold trading based on market trends, improving your trading strategies for both trending and range-bound conditions.
Read More →
Learn how to effectively use the MACD indicator for trading gold and oil, including strategies, configurations, and risk management tips.
Read More →
Explore how dynamic machine learning models are revolutionizing commodity price forecasting, overcoming the limitations of traditional methods.
Read More →
Understand how economic growth cycles impact commodity prices and the role of real-time data in navigating market fluctuations.
Read More →
BRICS nations are reshaping the global gold market by increasing reserves and developing alternative trading systems, challenging Western dominance.
Read More →
Explore the essential features of commodity price APIs, including real-time updates, historical data access, and customizable feeds for traders and analysts.
Read More →
Explore top APIs for trade compliance that automate checks, provide real-time data, and simplify global trade regulations.
Read More →
Wettability alteration using nanoparticles can significantly enhance gas production by optimizing fluid-rock interactions in reservoirs.
Read More →
Explore how sanctions reshape oil contracts, emphasizing compliance practices that enhance market stability and avoid legal pitfalls.
Read More →
Learn how to optimize cloud latency in commodity trading to seize opportunities and maximize profits with advanced hardware and real-time monitoring.
Read More →
Explore essential metrics and tools for monitoring API throttling to enhance performance and ensure system reliability.
Read More →
Explore the complexities of HazMat certification for natural gas in the U.S. and Canada, highlighting key regulatory differences and compliance strategies.
Read More →
Learn how to optimize costs with commodity APIs by managing requests, implementing caching, and monitoring usage effectively.
Read More →
Learn how to effectively manage API rate limits during seasonal traffic spikes to ensure system stability and fair access for all users.
Read More →
Optimize your large repositories with compression techniques to enhance performance, reduce storage costs, and streamline workflows.
Read More →
API audit trails are crucial for maintaining data integrity, preventing tampering, and ensuring compliance across industries such as finance and healthcare.
Read More →
Explore the top five technical indicators for commodity trading, including RSI, MACD, and Bollinger Bands, to enhance your market analysis.
Read More →
Explore the key factors driving price volatility in lithium and cobalt markets, from supply chain disruptions to evolving government policies.
Read More →
Understand essential KPIs for backend systems to enhance performance, reliability, and user satisfaction while preventing downtime.
Read More →
Explore the importance of real-time data APIs for enhancing machine learning models in volatile markets like commodities and trading.
Read More →
Explore the principles of ethical penetration testing, including legal compliance, data handling, and best practices for securing APIs and sensitive systems.
Read More →
Explore how gold serves as a safe haven during economic crises, analyzing its historical significance and investment strategies for uncertain times.
Read More →
Explore the evolution of India's gold consumption from 2010 to 2024, influenced by cultural practices, economic conditions, and government policies.
Read More →
Explore how edge computing and centralized systems shape low-latency trading, enhancing speed, scalability, and security for financial institutions.
Read More →
Explore essential rate limiting techniques for commodity APIs to maintain reliability and performance during market volatility and high demand.
Read More →
Explore the top APIs for tracking regional commodity prices, offering real-time data for energy, metals, and agriculture to optimize market strategies.
Read More →
Explore how load balancing enhances the performance and reliability of real-time market data feeds, ensuring swift responses during trading surges.
Read More →
Explore how subscription APIs enhance ERP systems with real-time commodity pricing, boosting accuracy and decision-making capabilities.
Read More →
Learn how support and resistance levels guide trading decisions in commodity markets, helping identify key entry and exit points.
Read More →
Learn how to create automated price alerts for commodities using JSON APIs, ensuring you stay informed on market changes in real-time.
Read More →
Real-time health monitoring enhances safety for gas workers by utilizing wearable devices, IoT sensors, and cloud platforms to prevent hazards and ensure compliance.
Read More →
Explore the evolving correlation between gold prices and stock indices, examining historical trends, market dynamics, and investment strategies.
Read More →
Access reliable real-time and historical commodity data with a 7-day free trial, ideal for traders, businesses, and developers.
Read More →
Learn how sub-200ms response times from an oil price API can enhance trading apps, enabling faster execution and improved risk management.
Read More →
Explore how real-time data and drilling intelligence empower energy traders to make informed decisions in volatile markets.
Read More →
Access live oil prices effortlessly with a simple setup, real-time updates, and easy integration for informed decision-making.
Read More →
Explore a reliable oil price API that offers real-time data, 99.9% uptime, and robust security, empowering businesses in the energy sector.
Read More →
Explore how APIs enhance trade compliance for commodities through real-time data, automation, cost savings, and improved security.
Read More →
Explore how commodity price fluctuations impact employment cycles across sectors and regions, influencing economic trends and job markets.
Read More →
Explore key providers of historical renewable energy data, comparing their strengths, accessibility, and pricing to inform your research and decision-making.
Read More →
Explore the significance of natural gas storage reports in shaping market dynamics, price trends, and trading strategies in the energy sector.
Read More →
Explore the cost, compliance, and performance differences among HFO, VLSFO, and MGO fuels in maritime operations and their impact on ROI.
Read More →
Explore the dynamics of Henry Hub pricing, its influence on natural gas markets, and how traders manage risks in an ever-changing landscape.
Read More →
Effective developer support is crucial for successful integration of commodity APIs, influencing project outcomes and reducing integration time.
Read More →
Understand the new marine fuel regulations for 2025, options for compliance, and strategies to manage costs and risks effectively.
Read More →
Explore the advancements in nanoparticle-assisted oil recovery, comparing mathematical and machine learning models for enhanced efficiency.
Read More →
Explore the intricate relationship between metal prices and stock markets, highlighting key drivers like economic conditions and central bank actions.
Read More →
Explore how economic growth influences Brent and WTI oil prices, highlighting the differences in global and domestic market dynamics.
Read More →
Explore the legal frameworks governing commodity derivatives in the U.S., including key regulations, enforcement, and compliance strategies.
Read More →
Explore how advancements in seismic imaging are revolutionizing energy exploration, reducing costs, and minimizing environmental impact.
Read More →
Explore the importance of interoperability in commodity APIs, highlighting solutions for seamless data integration and real-time updates.
Read More →
Explore the critical role of REST API authentication in safeguarding financial services against rising cyber threats and ensuring regulatory compliance.
Read More →
Explore gold's price evolution from the 1970s to the 2020s, revealing its role as a safe-haven asset during economic turmoil.
Read More →
APIs empower finance teams by providing real-time and historical commodity price data, enabling smarter decision-making in volatile markets.
Read More →
Learn how feature engineering enhances solar energy forecasting by integrating time and weather data for improved accuracy and efficiency.
Read More →
Learn effective strategies for horizontal scaling and load balancing to enhance application performance and reliability under heavy traffic.
Read More →
Explore how oil prices and renewable energy are interconnected through market trends, policy impacts, and investment shifts.
Read More →
Learn essential strategies for designing effective API access control policies to safeguard against rising security threats.
Read More →
Real-time data empowers investors to enhance diversification strategies, adapt to market changes, and manage risks effectively in volatile environments.
Read More →
Explore how APIs enhance commodity risk management through real-time data access, automation, and advanced analytics for informed decision-making.
Read More →
Understand how real-time APIs can help businesses monitor tariff impacts on commodity prices for smarter decision-making.
Read More →
Explore key considerations for designing data-driven financial apps, focusing on API selection, integration challenges, and user experience.
Read More →
Explore the intricate relationships between commodity cycles and stock market performance across various sectors, and learn investment strategies to navigate them.
Read More →
Learn how to effectively optimize API rate limits for scalability, ensuring reliable performance even during traffic spikes.
Read More →
Explore how blockchain enhances regulatory compliance in commodity trading through secure records, real-time audits, and automated processes.
Read More →
Explore the significance of low-latency APIs in real-time trading, their benefits, challenges, and solutions for optimizing performance.
Read More →
Learn how to enhance your Sierra Chart indicators by integrating external data for better market analysis and decision-making.
Read More →
Explore the top 7 commodity APIs for real-time market data across energy, agriculture, and metals to enhance your trading decisions.
Read More →
Learn essential steps for risk assessment in natural gas operations, focusing on safety, compliance, and efficient management of hazards.
Read More →
Learn how to effectively test API scalability in microservices by monitoring key metrics, using the right tools, and optimizing performance strategies.
Read More →
Explore how carbon pricing is reshaping commodity markets, impacting energy, metals, and agriculture while driving a shift towards sustainability.
Read More →
Explore the top 5 APIs for real-time Brent Crude and WTI data, offering reliable insights for traders and analysts to make informed decisions.
Read More →
Learn how to securely authenticate with the Sierra Chart API, troubleshoot common issues, and implement best practices for safe access.
Read More →
Explore how real-time pricing APIs are revolutionizing pricing strategies across industries, enhancing competitiveness and profitability.
Read More →
Explore how commodity prices influence stock markets, driven by economic factors, global events, and investment tools for smarter trading strategies.
Read More →
User feedback is key to refining financial dashboards, improving clarity, usability, and real-time data delivery for better decision-making.
Read More →
Explore how reward functions enhance decision-making in commodity trading by balancing profit and risk through precise data and optimization strategies.
Read More →
Explore how regional stock markets respond to oil price fluctuations, revealing opportunities and risks for investors across the globe.
Read More →
Explore the top industries driving gold demand, from electronics and medical equipment to jewelry and finance, highlighting gold's unique properties.
Read More →
Explore how transportation costs and storage levels at Cushing, Oklahoma, impact the Brent-WTI crude oil price spread and global market dynamics.
Read More →
Real-time price APIs are crucial for businesses to monitor market volatility caused by sanctions, enabling informed decisions and risk management.
Read More →
Understand how volume analysis enhances gold trading strategies by revealing market trends, sentiment, and optimal trading timings.
Read More →
Integrate real-time commodity prices into your trading strategies using JSON APIs in MetaTrader 4 for smarter decisions.
Read More →
Explore how transparency in cross-border oil trade enhances compliance, reduces fraud, and streamlines operations amidst regulatory challenges.
Read More →
Explore how commodity prices serve as key indicators for inflation, guiding businesses in making informed economic decisions.
Read More →
Explore how Monte Carlo simulation enhances commodity pricing by modeling price scenarios, assessing risk, and improving decision-making.
Read More →
Explore the essentials of commodity data feed APIs for real-time pricing, integration tips, and benefits across various industries.
Read More →
Understand forward contracts and CFTC compliance to effectively manage commodity trading risks while ensuring legal adherence.
Read More →
Explore the vital role of PRAs in oil price transparency, challenges they face, and how modern tools are reshaping market data access.
Read More →
Explore the differences between WTI and Brent Crude oil, including their characteristics, delivery methods, and the API features for real-time data tracking.
Read More →
Learn how to effectively manage commodity price risk through dynamic hedging strategies, real-time data monitoring, and risk analysis.
Read More →
Learn how schema mapping transforms real-time commodity data into standardized formats, enhancing accuracy and decision-making in trading.
Read More →
Explore how speculation influences commodity prices, affecting volatility, liquidity, and market dynamics while highlighting the importance of real-time data.
Read More →
Explore how AI enhances risk management in commodity trading with real-time data integration, price prediction, and automated decision-making.
Read More →
Explore the energy demands of CO2 removal technologies, their efficiencies, and the innovations driving advancements in climate solutions.
Read More →
Real-time data validation is crucial for ensuring accuracy in commodity APIs, impacting trading decisions and risk management.
Read More →
Explore essential credit risk tools for commodity trading, focusing on real-time data, analytics, and automated monitoring to enhance risk management.
Read More →
Learn how Pressure Swing Adsorption efficiently removes CO2 from natural gas, ensuring compliance with quality standards in gas processing.
Read More →
Explore how geospatial data enhances commodity price forecasting through advanced monitoring techniques and real-time insights across agriculture and energy sectors.
Read More →
Learn effective strategies for managing risks in volatile markets, including diversification, hedging, and leveraging real-time data.
Read More →
Understand the common compliance risks in commodity trading to avoid fines and ensure regulatory adherence with effective strategies.
Read More →
Explore how U.S. and global debt crises influence gold prices, revealing distinct patterns in market behavior during financial uncertainty.
Read More →
G7 and G20 sanctions on natural gas are reshaping global energy markets, highlighting differences in approach and the impact on energy security.
Read More →
Learn how to optimize real-time data throughput in APIs for improved performance, scalability, and business efficiency.
Read More →
Explore how policy gradient methods enhance trading strategies in volatile commodity markets by leveraging real-time data for improved decision-making.
Read More →
Learn essential API caching techniques to enhance performance, reduce costs, and ensure data reliability in your applications.
Read More →
Ensure your backend systems comply with security, data management, and performance standards to maintain reliability and protect sensitive information.
Read More →
Explore how LNG export rules shape U.S. natural gas prices through supply, demand, and regulatory changes, impacting both markets and economies.
Read More →
Sanctions are reshaping global natural gas exports, prompting countries to innovate with LNG and new trade routes amidst financial challenges.
Read More →
Learn how to enhance gold price predictions through effective feature engineering, utilizing economic indicators and technical metrics.
Read More →
Learn how to protect workers in the natural gas industry with essential PPE and regulatory compliance strategies.
Read More →
Learn key strategies for building fault-tolerant API systems, ensuring reliability and performance even during failures.
Read More →
Explore the ethical dilemmas surrounding AI-driven pricing algorithms, including bias, data privacy, and the need for transparency.
Read More →
Explore the essential features and benefits of metals commodity APIs, offering real-time data and insights for trading, risk management, and supply chain decisions.
Read More →
Learn essential API encryption methods and best practices to secure sensitive data, ensuring privacy and compliance with regulations.
Read More →
Explore how energy policies impact commodity prices through key metrics like energy use, carbon pricing, and EV adoption rates.
Read More →
Learn how Privileged Access Management protects APIs through secure authentication, credential management, and compliance strategies.
Read More →
Explore key rate limiting algorithms like Token Bucket, Leaky Bucket, and Sliding Window to manage traffic flow in distributed systems efficiently.
Read More →
Explore how global energy policies are influencing farming costs and food prices, affecting everything from crop use to market stability.
Read More →
Explore essential API security practices for CI/CD pipelines, including authentication, testing, monitoring, and compliance to safeguard your workflows.
Read More →
Explore essential tips for integrating the TradeStation API, focusing on security, performance, and effective error handling.
Read More →
Learn essential strategies to prevent API injection attacks and enhance your web application's security against common vulnerabilities.
Read More →
Explore how CTRM software integration enhances trading efficiency, offering solutions like API, middleware, and cloud-based systems.
Read More →
Explore how seasonal shifts, long-term cycles, and trading events shape commodity prices for more accurate market predictions.
Read More →
Explore the evolving landscape of global commodity trading regulation, its key players, and the impact on market participants and compliance.
Read More →
Learn how to manage API rate limits effectively with strategies that optimize calls, monitor usage, and prevent disruptions.
Read More →
Explore the critical differences between API security and compliance, their distinct goals, and how they integrate to protect sensitive data.
Read More →
Learn how to build an effective breach response plan that minimizes risks associated with third-party vendors and protects your organization.
Read More →
Integrate CQG API into your trading system with this comprehensive guide covering setup, security, market data access, and trade execution.
Read More →
Explore critical API security risks in commodity data services and discover effective strategies to safeguard sensitive market data.
Read More →
Explore how blockchain enhances security and efficiency in commodity trading, tackling fraud and improving transaction processes.
Read More →
Explore effective feature engineering techniques for enhancing oil price forecasting accuracy, integrating external data, and refining models.
Read More →
Learn how to use the Ichimoku Cloud to analyze gold prices, identify trends, and make informed trading decisions with key signals and tools.
Read More →
Explore how finance teams leverage APIs for secure access control, ensuring compliance and operational efficiency in a rapidly evolving regulatory landscape.
Read More →
Explore how gold serves as a reliable asset during economic crises, preserving wealth in hyperinflation, recessions, and market crashes.
Read More →
Explore the limitations of the ADX indicator in gold trading, including signal delays and market volatility, and learn how to enhance its effectiveness.
Read More →
Explore the top cloud tools for commodity risk management, featuring real-time data, advanced analytics, and seamless integration for businesses of all sizes.
Read More →
Explore how data licensing influences costs, access, and efficiency in commodity price APIs, and choose the best model for your business needs.
Read More →
APIs streamline commodity price data management, enabling real-time updates, reducing errors, and improving decision-making efficiency.
Read More →
Explore the key differences between the MACD line and signal line, essential tools for analyzing market trends and momentum in trading.
Read More →
Explore how AI is revolutionizing retail pricing, enhancing revenue, margins, and responsiveness to market dynamics.
Read More →
Explore the contrasting gold demands of India and China shaped by cultural traditions and economic factors, revealing unique market dynamics.
Read More →
Explore how data mapping for commodity APIs enhances trading decisions through accurate integration and market analysis.
Read More →
Explore how MACD can effectively analyze gold price trends, momentum shifts, and potential reversals using real-time data integration.
Read More →
Gold consistently rises during recessions, making it a key asset for protecting wealth in uncertain economic times.
Read More →
Explore essential strategies for backend security, including patch management, configuration management, and API protection to safeguard your systems.
Read More →
Explore the essential role of real-time data in automated trading systems for improved decision-making and risk management.
Read More →
Learn how dynamic rate limiting enhances API performance and security by adapting to real-time traffic needs and preventing misuse.
Read More →
Explore three effective moving average strategies for forecasting oil prices, including SMA, EMA, and MACD, to enhance trading decisions.
Read More →
Learn effective techniques to optimize API calls for real-time commodity data, enhancing speed, reliability, and performance.
Read More →
Explore the fundamentals of Event-Driven Architecture, its benefits, challenges, and applications in real-time data processing across various industries.
Read More →
Explore the critical third-party risks in commodity trading, from data breaches to compliance failures, and learn effective management strategies.
Read More →
Explore five algorithms that effectively detect outlier movements in commodity prices, enhancing market monitoring and decision-making.
Read More →
Explore how real-time outlier detection enhances trading strategies and risk management in commodity markets through advanced analytics and machine learning.
Read More →
The Russia-Ukraine conflict has drastically affected global commodity prices, stock markets, and supply chains, creating uncertainty for investors.
Read More →
Geopolitical risks significantly influence commodity price volatility, necessitating strategic risk management for finance professionals.
Read More →
Explore how Protobuf enhances real-time commodity data transfer with smaller sizes, faster processing, and adaptable schemas for dynamic markets.
Read More →
Explore the speed and efficiency of Protobuf compared to JSON, uncovering their strengths and ideal use cases for data transfer.
Read More →
Explore how big data transforms financial forecasting, enhancing accuracy, risk management, and real-time decision-making for finance professionals.
Read More →
Explore how speculation influences price swings in precious metals and the strategies to manage associated risks.
Read More →
Explore how speculation drives gold market volatility, influenced by investor sentiment, supply-demand imbalances, and trading strategies.
Read More →
Explore how big data tools enhance commodity price forecasting through real-time data, AI, and advanced analytics for better decision-making.
Read More →
Explore the advantages of cloud-based commodity data for traders, including real-time access, scalability, automation, and advanced analytics.
Read More →
Explore how certification influences Brent Crude pricing, ensuring quality, market confidence, and stability in the global oil industry.
Read More →
The EPA's new methane rule mandates strict emission controls for natural gas, imposing compliance costs and operational changes to reduce emissions by 80%.
Read More →
Explore the EPA's new methane rules aimed at reducing emissions by 80% in the natural gas sector, detailing compliance steps and expected benefits.
Read More →
Learn how CFTC position limits regulate commodity trading, ensuring market stability and preventing manipulation while allowing for risk management.
Read More →
Explore how banking crises influence gold prices and the importance of real-time tracking for informed investment decisions.
Read More →
Gold prices surged 9.2% in Q1 2023 amid banking turmoil, highlighting its status as a safe-haven asset during financial crises.
Read More →
Explore how Weighted Moving Average enhances commodity price forecasting by balancing recent trends with historical data for better trading decisions.
Read More →
Explore the advantages of Weighted Moving Averages in trading, powered by APIs for real-time data and customizable analysis.
Read More →
Learn how commodities can protect your wealth against inflation by analyzing market trends and utilizing real-time data for informed investment strategies.
Read More →
Explore essential commodity price APIs that provide vital data for inflation risk analysis, helping organizations make informed decisions.
Read More →
Learn how real-time log analysis enhances commodity price API performance, ensuring accurate data and quick issue resolution during market fluctuations.
Read More →
Learn how to implement sliding window counters for effective API rate limiting, ensuring stability and fair access while managing traffic bursts.
Read More →
Explore the sliding window counter method for API rate limiting, ensuring stability and fair usage while preventing overload and malicious traffic.
Read More →
Effective API logging is essential for regulatory compliance and security, focusing on best practices and industry-specific needs.
Read More →
Understand key requirements for API logging to ensure compliance with regulations like PCI DSS, GDPR, and HIPAA while enhancing security.
Read More →
Explore how regulations shape oil pricing dynamics, influencing Brent Crude and WTI through historical and modern market factors.
Read More →
Explore the compliance challenges faced by Brent and WTI oil markets, focusing on regulations, environmental risks, and the need for global cooperation.
Read More →
Learn how continuous monitoring enhances regulatory compliance in commodity trading through key tools and strategies for effective risk management.
Read More →
APIs enhance third-party risk monitoring by automating data collection, providing real-time insights, and improving security and compliance.
Read More →
Explore the essential differences between real-time and historical data in commodity markets and their impact on trading strategies.
Read More →
Explore best practices for integrating commodity data APIs to enhance decision-making, data security, and market analysis for your business.
Read More →
Learn effective techniques to protect JSON APIs from XSS attacks, including input validation, output encoding, and content-type enforcement.
Read More →
Explore how speculation shapes energy prices, driving volatility and influencing market behavior in oil and gas trading.
Read More →
Explore how currency fluctuations, particularly the US dollar, impact global commodity prices and the factors influencing this relationship.
Read More →
Explore the critical differences between real and nominal prices, their impact on purchasing power, and how to make informed financial decisions.
Read More →
Explore how sentiment analysis influences commodity prices, combining market insights with economic data for better trading strategies.
Read More →
Learn essential steps for implementing REST API auditing to enhance security and ensure compliance with industry standards.
Read More →
Explore the differences between Brent and WTI crude oil prices, their historical trends, and the factors influencing their market dynamics.
Read More →
Explore the impact of natural gas storage levels on market trends and pricing, with insights into regional variations and seasonal patterns.
Read More →
Explore the essential features and top providers of petrochemical data APIs for better market insights and decision-making in a growing industry.
Read More →
Explore the top 5 commodity price APIs for 2024, offering real-time and historical data to help businesses make informed market decisions.
Read More →
Learn how the Token Bucket Algorithm effectively manages API rate limiting, ensuring stability and fair resource distribution during traffic spikes.
Read More →
Learn essential steps for effective natural gas emergency response, from identifying risks to coordinated evacuations and ongoing training.
Read More →
Explore the contrasting behaviors of gold and stocks during economic crises, revealing their roles as safe havens and growth assets.
Read More →
Explore essential practices for securing APIs in 2024, addressing common vulnerabilities and ensuring data protection.
Read More →
Learn how to use RSI for gold trading to identify buying and selling opportunities with technical analysis strategies.
Read More →
Interest rates significantly influence commodity derivative prices, affecting storage costs, trading behavior, and currency values.
Read More →
Explore the factors driving gold price volatility, from global events to supply and demand dynamics, and learn how to navigate these trends effectively.
Read More →
Learn how to implement API audit logging for security, compliance, and troubleshooting, including best practices and essential features.
Read More →
Explore the relationship between gold prices and inflation in 2024, including insights on central bank activities and market trends.
Read More →
Explore the volatile natural gas market in 2024, driven by geopolitical tensions, supply chain disruptions, and evolving pricing strategies.
Read More →
Explore five effective feature engineering methods that enhance machine learning model accuracy for commodity trading.
Read More →
Discover how real-time data APIs can transform your oil trading strategies. Learn to access accurate, up-to-the-minute data on oil futures and indexes to boost profitability and stay ahead in the competitive oil market.
Read More →
Explore essential API session management best practices to enhance security, prevent unauthorized access, and safeguard user data effectively.
Read More →
Explore how geopolitical risks influence oil price volatility, from supply disruptions to demand shifts, and learn strategies to manage these impacts.
Read More →
Explore 10 essential MFA best practices for API security in 2024, ensuring robust protection against automated attacks and data breaches.
Read More →
Explore how oil price shocks impact inflation across global economies and the varying effects on rich and developing countries.
Read More →
Explore the strengths and weaknesses of neural networks and time series models in commodity forecasting. Learn how to optimize your predictions.
Read More →
Discover essential hedging strategies to protect your business from volatile commodity prices and ensure stable cash flow in uncertain markets.
Read More →
Discover the top 7 sources for timber market data in 2024, helping you track prices and trends effectively for smart decision-making.
Read More →
Explore the differences between JSON and XML as API data formats, including their strengths, weaknesses, and best use cases for integration.
Read More →
Learn essential practices to protect your APIs from DDoS attacks, ensuring robust security and minimizing service disruptions.
Read More →
Explore how central bank policies influence gold prices, including interest rates, economic uncertainty, and market trends.
Read More →
Discover how AI is reshaping commodity sentiment analysis, enhancing risk management, and improving trading decisions while highlighting its limitations.
Read More →
Explore how military conflicts impact energy markets, causing price volatility, supply disruptions, and a renewed focus on energy security.
Read More →
Discover the best mobile apps for tracking real-time commodity prices, features to consider, and tips for safe trading on the go.
Read More →
Explore gold's complex relationship with inflation over the past century, revealing its role in investment strategies during economic uncertainty.
Read More →
Discover essential API testing tools and techniques to ensure software reliability, performance, and security in your applications.
Read More →
Explore the Black-Scholes model, its history, applications, pros and cons, and its ongoing relevance in modern finance.
Read More →
Discover how central banks influence gold prices through interest rates, money supply, and economic policies. Learn key investment tips.
Read More →
Discover how currency fluctuations affect gold prices, including the impact of the U.S. dollar, Euro, and emerging economies on the gold market.
Read More →
Discover how news sentiment impacts commodity prices and explore strategies to navigate the challenges in trading effectively.
Read More →
Discover the top 10 commodity price apps for 2024, featuring tools for traders, investors, and beginners to stay informed in the commodity market.
Read More →
Explore the regional differences in natural gas prices across the US in 2024, driven by supply, demand, weather, and infrastructure.
Read More →
Explore how CPI data influences gold prices in 2024, including expert predictions and key market factors driving trends.
Read More →
Discover essential API rate limiting best practices for 2024, ensuring stability, security, and user satisfaction in your systems.
Read More →
Discover best practices for preventing API security misconfigurations in 2024 and ensure robust protection against data breaches.
Read More →
Discover best practices for integrating commodity APIs with trading platforms to enhance efficiency, security, and trading strategies.
Read More →
Explore the top real-time futures data APIs of 2024, comparing features, coverage, pricing, and more to enhance your trading strategies.
Read More →
Explore how gold recycling is transforming the market, balancing supply and demand while benefiting the environment and driving innovation.
Read More →
Discover the top commodity data APIs for finance professionals in 2024. Compare features, pricing, and trends to find the right fit for your needs.
Read More →
Explore gold's role as a hedge against currency devaluation, comparing it with treasury bonds and other precious metals for investment strategies.
Read More →
Discover how Fibonacci retracement can enhance your gold trading strategy by identifying key price levels and combining with other analysis tools.
Read More →
Discover how geopolitical tensions influence gold prices and learn investment strategies to navigate these turbulent times.
Read More →
Understand the differences between API latency and response time, their impact on performance, and strategies to optimize them for better user experience.
Read More →
Discover how retail pricing APIs transform pricing strategies, boost sales, and enhance market agility in 2024.
Read More →Analytics preferences
We use product analytics and session replay to understand signup, dashboard, and checkout friction. You can reject non-essential analytics and still use the site.
Privacy policy