If I’m building with gasoline price data, here’s the short answer: RBOB is the U.S. wholesale gasoline benchmark, not the pump price. I should store it as a market index, fetch it from the latest-price API with GASOLINE_USD, save clean fields like price, unit, and created_at, and then add taxes, transport, basis spreads, and margin if I want a pump-price estimate.
In plain terms, this article says three things:
- RBOB is unfinished gasoline blendstock, priced in U.S. dollars per gallon, and used as the main wholesale reference for U.S. gasoline markets.
- Retail prices do not match RBOB one-for-one. Pump prices usually move later and include extra costs, local spreads, and taxes.
- For app and data work, I should use a backend fetch-and-cache setup with
GET https://api.oilpriceapi.com/v1/prices/latest, keep timestamps in UTC ISO 8601, and separate raw values from UI display values like $2.85.
A few details matter right away:
- The feed uses the commodity code
GASOLINE_USD - The article says the data updates every 5 minutes during market hours
- RBOB is often tied to New York Harbor pricing, so local markets can trade above or below that level
- For hedge and risk views, a 0 per barrel crude move is about $0.24 per gallon (0 ÷ 42 gallons) before taxes, refining margin and distribution, so the pump price does not move one-for-one or immediately
If I had to boil it down even more, I’d say this: use RBOB as the base number, not the final number. Then build spreads, lag logic, and local pricing rules on top of it.
| What I need to know | Short answer |
|---|---|
| What is RBOB? | A U.S. wholesale gasoline benchmark |
| Is it the pump price? | No |
| Unit | USD per gallon |
| API code | GASOLINE_USD |
| Best use in software | Index for dashboards, fuel tools, and hedge tracking |
| What else I need for retail estimates | Taxes, transport, basis spreads, blending, and margin |
That’s the core of the article in one view.
The rest is about using that data cleanly in apps, sheets, dashboards, and pricing models.
RBOB Basics: The U.S. Wholesale Gasoline Benchmark
What RBOB Represents in Fuel Markets
To use RBOB the right way in software, it helps to start with what it is.
Reformulated Blendstock for Oxygenate Blending (RBOB) is traded on futures exchanges and priced in USD per gallon. It is not finished gasoline. It is an unfinished gasoline blendstock that gets oxygenates, such as ethanol, added later at the terminal to make finished gasoline. Since 2006, RBOB has been the underlying commodity for U.S. gasoline futures contracts.
Most physical delivery is tied to New York Harbor terminals, and other U.S. regions often trade as basis differentials against that market. That detail matters more than it may seem at first glance. If you're building regional retail estimates, a national RBOB headline price won't tell the whole story. You still need the local basis spread to reflect supply conditions in that area.
What Drives RBOB Prices
RBOB tends to follow crude oil first. After that, prices are shaped by refinery utilization, seasonal demand, and supply disruptions such as refinery outages, weather events, or geopolitical shocks.
That behavior is a big clue for system design. RBOB should be handled as a moving wholesale input, not as a finished consumer price.
Why RBOB Matters in Software Systems
RBOB can play different roles depending on the system.
In retail-fuel dashboards, it often acts as the starting point for estimated pump prices. In logistics and fleet systems, it can serve as the base index for fuel surcharge calculations. In hedging tools, it is the benchmark behind futures, options, and swaps, which means hedge positions should be linked to specific RBOB contract months and delivery periods.
Do not treat RBOB as pump price. Store it as a reference index, then layer in taxes, transport, storage, and margin when estimating what drivers will pay at the pump.
Next, compare that wholesale benchmark with the retail pump price it helps explain.
sbb-itb-a92d0a3
From Wholesale RBOB to Retail Pump Prices
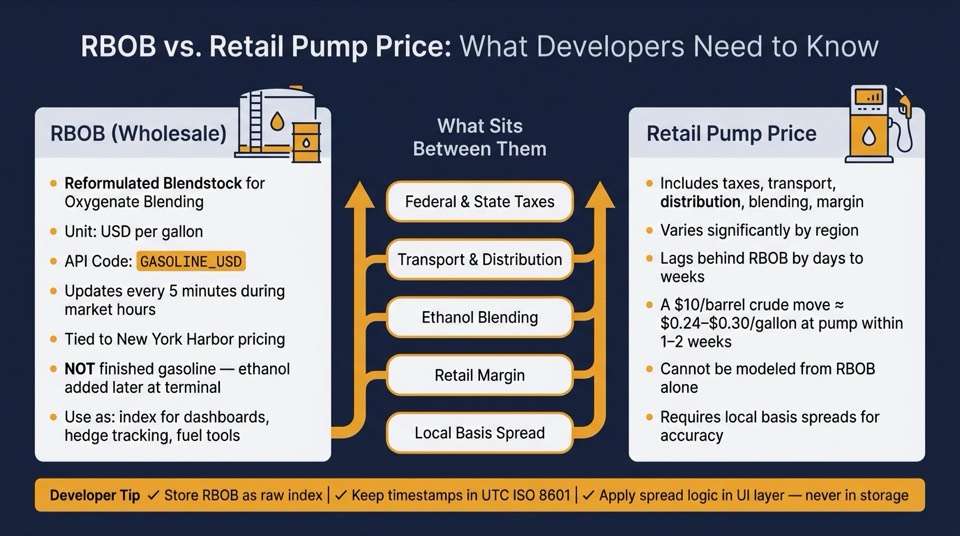
RBOB vs. Retail Pump Price: What Developers Need to Know
Why Pump Prices Differ From RBOB
That wholesale benchmark only gets you part of the way. RBOB is just one input in retail gasoline pricing.
Before gasoline reaches the pump, extra costs get added on top of the wholesale price, including taxes, transport, distribution, and retail margin. That’s why pump prices can vary so much from one place to another. Local differences make retail pricing harder to model, and a single national RBOB price won’t reflect those local spreads.
How to Model Retail Price Relationships
Use RBOB as a wholesale input, not as a stand-in for pump prices. Retail prices usually move after wholesale prices, so your model should include a lag between wholesale changes and retail pricing.
For regional estimates, use local basis spreads and market data. That spread pulls in taxes, logistics costs, and market structure in a way a global oil market flat markup just can’t. In practice, retail estimates work best as directional signals, and they should be recalibrated by market.
Once the retail relationship is clear, the next step is storing the data cleanly and wiring in the API feed.
Gasoline vs. Diesel Benchmarks: A Quick Comparison
If your app tracks more than one fuel type, it helps to compare gasoline and diesel side by side. You might also consider natural gas price analysis for a complete energy dashboard.
| Feature | Gasoline (RBOB) | Diesel (ultra-low sulfur diesel (ULSD)) |
|---|---|---|
| Benchmark purpose | U.S. wholesale gasoline benchmark for consumer vehicles | Critical benchmark for transportation, logistics, and shipping |
| Retail mapping challenges | Requires 10% ethanol blending and has high regional tax variance | Sensitive to global shipping demand and industrial activity |
| Commodity code | GASOLINE_USD |
DIESEL_USD |
For diesel comparisons, see the live diesel price feed and diesel price API documentation.
RBOB Data Structures and API Integration
Fields to Store and Normalize
Once you connect RBOB to your pricing workflow, store each snapshot in one consistent schema. That keeps units from drifting, clears up timestamp confusion, and makes historical comparisons much easier - especially when you line wholesale data up against retail pricing from the previous section.
At a minimum, store these fields for every RBOB price record:
code(for example,GASOLINE_USD)price(numeric decimal)currency(USD)unit(gallon)created_at(ISO 8601 UTC timestamp)
If your feed also includes type and source - such as spot_price and market_reporting - store them too. Those fields help with audits and make it easier to tell one market session or reporting source from another.
Two rules matter here. First, always store timestamps in UTC ISO 8601. Second, handle display formatting separately. For U.S.-facing interfaces, show dates as MM/DD/YYYY and prices with a leading $. Keep locale-specific formatting out of storage and API payloads so you don't run into parsing issues later.
The same idea applies to price values. Leave the raw price field untouched for math, and use a separate display field like $2.85 only for the UI.
How to Call the Latest Price Endpoint With OilPriceAPI
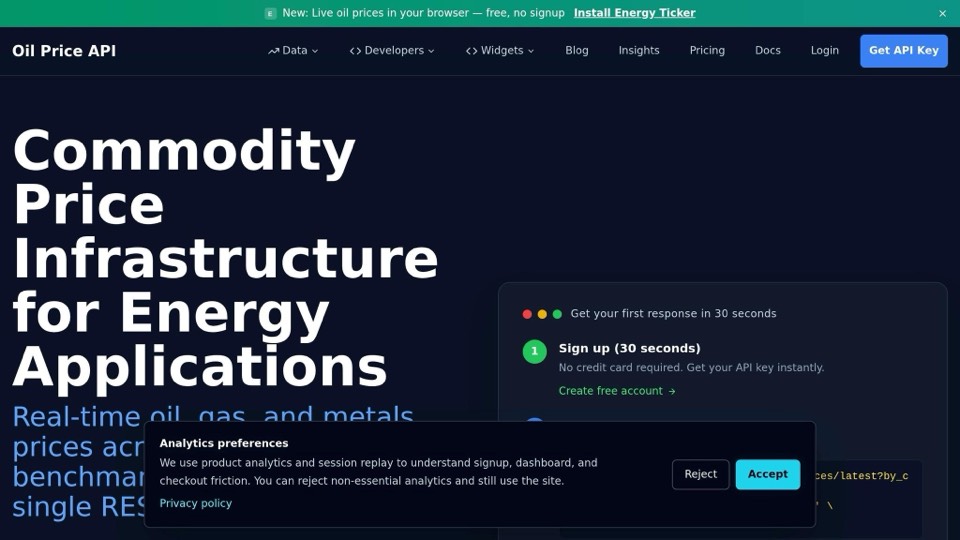
GET https://api.oilpriceapi.com/v1/prices/latest
Authorization: Token YOUR_API_KEY
Use this endpoint when you need the latest RBOB snapshot. Keep the API key on the server side, and cache responses through a scheduled backend job. In plain English: don't stick the key in frontend JavaScript. Put it in a server-side environment variable or a secrets manager.
Call the endpoint on a schedule, store each response with a retrieval timestamp, and serve cached values to dashboards or lookup tools. That setup keeps the UI fast and makes API usage easier to control.
If a request fails, log the error in a way your team can act on. A 401 Unauthorized usually points to an invalid or expired key. It's also smart to show users whether the price on screen is current, cached, or delayed. That small label saves a lot of confusion.
For the full response schema and the list of available commodity codes, see the API documentation. Cached snapshots also make it easier to spot wholesale moves before retail prices catch up.
Integration Paths: Python, Node.js, Excel, and Google Sheets
Use Python or Node.js for backend automation. Use Excel or Google Sheets when the job is manual reporting or light internal tracking.
For backend services that feed dashboards, alerts, or databases, both Python and Node.js can call the latest-price endpoint, transform the JSON response, and write it to a cache or database. The Python oil price API tutorial shows how to do this with the requests library, a session object, and an environment variable for the API key. The Node.js oil price API tutorial walks through the same flow with axios or the native fetch API in a server-side setup.
If your team just needs light monitoring or internal reporting without building a full app, the Excel guide and Google Sheets guide show how to pull RBOB prices straight into cells with the GASOLINE_USD code.
When the workflow needs scheduled refreshes, database writes, or downstream automation, use the API as the source of truth. Treat the spreadsheet as the presentation layer, not the system of record.
That normalized feed can then power dashboards, fuel lookups, and hedging tools.
Building Dashboards, Fuel Lookups, and Hedging Tools
Once your feed is normalized, use RBOB as the live baseline for spreads, lookups, and exposure models.
Retail Dashboards and Fuel Lookup Workflows
A retail fuel dashboard should treat RBOB as a wholesale benchmark, not a retail quote.
The best setup is pretty simple: pull the latest RBOB snapshot from a backend job, cache it, and serve that cached value to the UI. Store the data with its created_at timestamp so users can tell whether they're looking at a current number or one that's slightly delayed. That keeps dashboards fast and avoids confusion.
The most useful views don't show RBOB or retail prices in isolation. They show the spread instead: retail price minus RBOB. That's the number operators usually care about. A shaded area chart that plots RBOB and retail gasoline together can make timing gaps easier to spot, especially when retail prices are slow to react to a wholesale move.
For fuel lookup workflows, fetch the current RBOB price, subtract it from the posted pump price, and flag stations that fall outside your target margin. In the UI, label RBOB clearly as the wholesale benchmark, not the pump price. The same baseline also works for station-level lookups.
The live feed can do more than power lookups. It can also support exposure and hedge tracking.
Risk and Hedging Use Cases
For exposure tracking and hedging dashboards, RBOB works best as a risk indicator.
Build scenario views with sliders that adjust RBOB and show the modeled margin impact through a simple pass-through model. A $10/barrel crude move equals about $0.24 per gallon ($10 ÷ 42 gallons) before taxes, refining margin and distribution. This unit conversion does not establish the size or timing of a retail pump-price response.
Store your benchmark fields and business exposure fields in the same time-series structure. That includes:
- Benchmark fields:
price,unit,created_at,source - Exposure fields:
forecast_volume,hedged_volume,contract_price
With that setup, the dashboard can calculate unhedged exposure on the fly against a live RBOB feed. You can also set threshold alerts for cases where RBOB pushes margins below your floor.
One thing needs to be stated plainly: the RBOB-to-retail spread is an approximation. It changes by region, tax regime, and market conditions.
Conclusion: Key Takeaways and Next Steps
Three points matter most when you embed RBOB data into operational tools.
- RBOB is the primary U.S. wholesale gasoline benchmark, so it's the right reference point for spreads, hedging inputs, and trend analysis.
- Retail pump prices need explicit spread logic because taxes, distribution, blending, and margin sit between the benchmark and the price at the pump.
- Clean integration starts with a normalized schema:
code,price,currency,unit,source, andcreated_at, stored in UTC, with display formatting handled separately in the UI layer.
Define your fuel schema, show spreads and scenarios relative to RBOB, and run a backend service that fetches and caches RBOB for downstream tools. To get started, grab a free API key at https://www.oilpriceapi.com.
FAQs
How do I estimate pump prices from RBOB?
RBOB gasoline is the main benchmark for U.S. wholesale gasoline prices. If you want to estimate what drivers will pay at the pump, start with the wholesale RBOB price and add a local markup, often called the retail spread.
That spread covers things like regional taxes, transportation, distribution costs, and local retail margins. And those numbers can shift as market conditions change. So if you pair live RBOB data with your own regional tax and margin figures, you can get a closer estimate of pump prices.
Why doesn’t RBOB match local gas prices?
RBOB is the U.S. wholesale gasoline benchmark, not the retail price you see at the pump.
It tracks the commodity cost of unblended gasoline. Local gas prices, on the other hand, also include taxes, ethanol blending, distribution and transportation costs, and gas station retail margins.
RBOB trends usually move in the same direction as pump prices. But regional supply differences and local competition often create a gap between the two.
How often should I fetch and cache RBOB data?
RBOB Gasoline benchmarks update every 5 minutes, so your fetch and cache schedule should line up with that window.
That said, a fixed timer on its own isn't enough. Use the timestamp metadata in each API response to make sure the data is fresh enough for your workflow before you refresh your cache. That extra check helps you avoid pulling data too early, too late, or for no good reason.
If you run into short-term network problems or an HTTP 429 response, use exponential backoff. It’s a simple way to ease off instead of hammering the API when something goes wrong.