Historical Commodity Data from Government Sources
Historical Commodity Data from Government Sources
Tracking commodity prices over time is essential for understanding markets, making informed financial decisions, and planning strategies. Government agencies like the EIA, USDA, and USGS have decades of reliable, inflation-adjusted data covering energy, agriculture, and minerals. These datasets provide a long-term look at trends, risks, and economic impacts, all while being affordable or free.
Key points:
- Energy: EIA tracks crude oil and natural gas prices since 1946.
- Agriculture: USDA offers crop and livestock data going back to the 1920s.
- Minerals: USGS covers 90+ minerals with records starting in 1900.
- Global Insights: IMF tracks prices for 68 commodities across 182 economies since 1962.
While government data is detailed and trustworthy, it has limitations like slower updates and gaps in niche markets. Pairing it with tools like OilpriceAPI for real-time data offers a complete solution for analysts, traders, and researchers.
Major Government Data Providers
The U.S. government runs several agencies that maintain extensive databases on historical commodity data. Each agency specializes in a specific market sector, compiling decades - or even over a century - of detailed records.
U.S. Energy Information Administration (EIA)
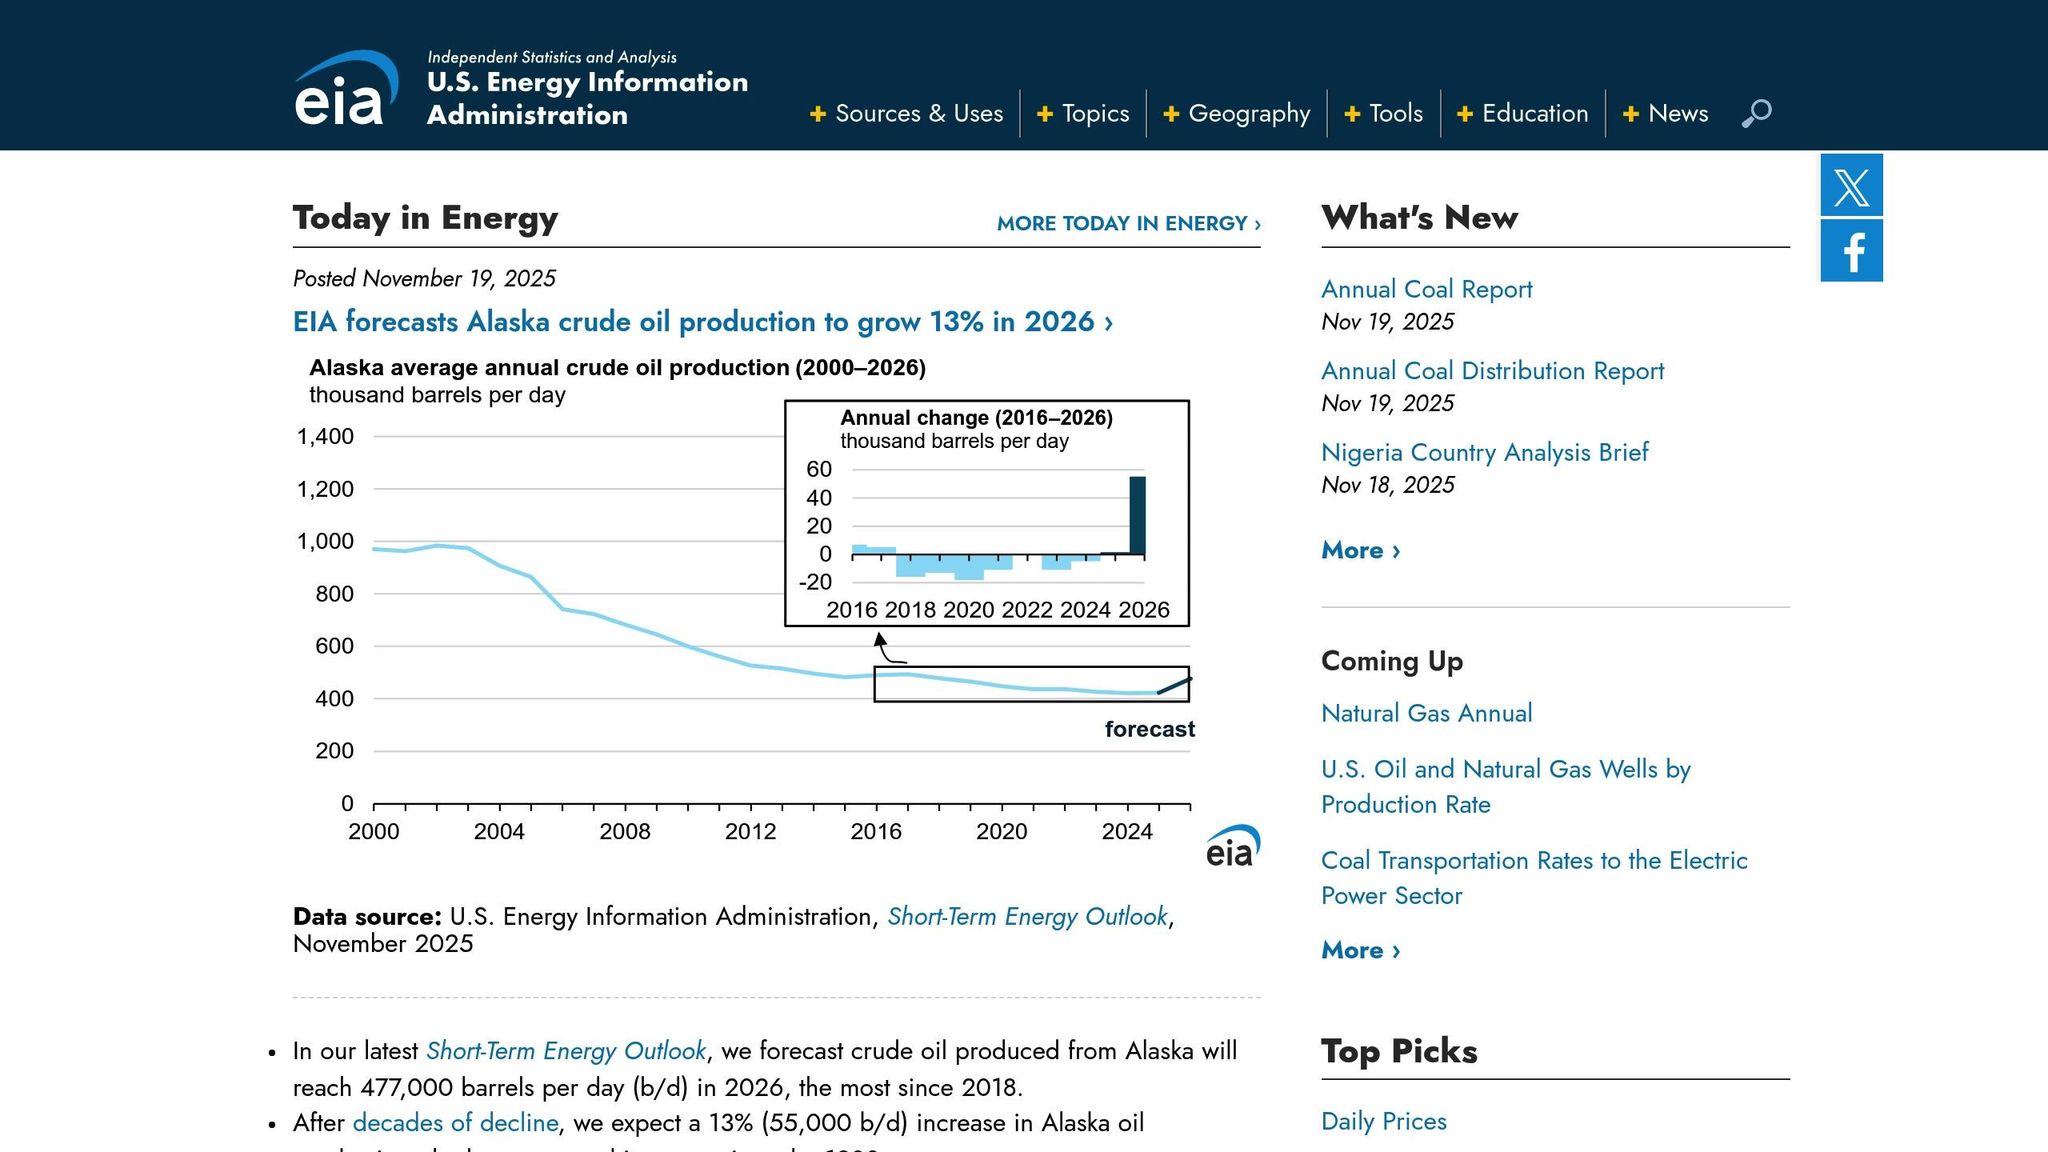
The EIA is the go-to source for energy commodity data in the United States. Its Spot Prices for Crude Oil and Petroleum Products database tracks daily closing prices for key commodities like WTI crude, Brent crude, natural gas, and refined products. The records stretch back to January 1946 and are updated at various intervals - daily, weekly, monthly, and annually. Data is available for download in CSV and Excel formats, making it accessible for analysis.
U.S. Department of Agriculture (USDA) Economic Research Service
For agricultural commodities, the USDA Economic Research Service is a key resource. Its Commodity Costs and Returns series provides both recent and historical data, including organic cost estimates and returns for crops like corn, wheat, soybeans, and milk. It also offers cost-of-production forecasts for major U.S. field crops. Additionally, the Production, Supply and Distribution Database delivers agricultural production and consumption statistics for countries worldwide, with data going back to 1960 [2, 13].
U.S. Geological Survey (USGS)
The USGS manages a database covering nearly 90 mineral commodities, including gold, copper, and rare earth elements. This resource dates back to 1900 and includes detailed statistics on production, trade, stocks, consumption, and unit values. It’s an essential tool for mining analysts tracking long-term trends in critical minerals like lithium and cobalt. The database is updated annually.
Additional Data Sources
Several other organizations provide valuable commodity data:
- The Federal Reserve Economic Data (FRED) system, managed by the St. Louis Federal Reserve, offers a wide range of economic and commodity price series. Its data includes Producer Price Index records dating back to January 1913.
- The U.S. Bureau of Labor Statistics (BLS) has been compiling commodity indices since 1934. Its Producer Price Index databases include series like Industrial Chemicals, with some data available as far back as January 1933 [1, 12].
- For international data, the International Monetary Fund (IMF) tracks primary commodity prices and country-specific indices for 182 economies. The IMF’s records date back to 1962, with price data starting in 1992. Figures are updated monthly and provided in both U.S. dollars and Special Drawing Rights (SDRs).
These resources offer streamlined access to historical datasets, making data extraction and analysis more efficient than ever.
| Agency | Primary Focus | Historical Range | Key Commodities | Update Frequency |
|---|---|---|---|---|
| EIA | Energy commodities | January 1946–present | WTI crude, Brent crude, natural gas, petroleum products | Daily/Weekly/Monthly |
| USDA ERS | Agricultural commodities | Varies by series | Corn, wheat, soybeans, livestock, organic crops | Varies |
| USGS | Mineral commodities | 1900–present | Gold, copper, rare earth elements, 90+ minerals | Annual |
| FRED | Broad commodity indices | 1913–present | Producer prices, commodity indices | Monthly/Weekly |
| BLS | Producer price indices | 1913–present | Industrial chemicals, finished goods | Monthly |
| IMF | Global commodities | 1962–present (indices) | Primary commodities across 182 economies | Monthly |
With the transition to online databases, accessing these extensive historical records has never been easier, setting the stage for advanced analysis in the following sections.
How to Access Historical Commodity Data
Thanks to advancements in technology, government agencies now provide interactive online portals that make accessing historical commodity data easier than ever. These platforms allow users to locate, filter, and download extensive datasets with just a few clicks.
Using Online Data Portals
One of the most accessible tools for commodity price research is the Federal Reserve Economic Data (FRED) system. FRED provides a wealth of regional and national financial data, complete with built-in tools for searching, graphing, and downloading. For example, the Producer Price Index by Commodity offers data ranging from January 1913 to August 2025.
The IMF's Commodity Data Portal takes a more visual approach, allowing users to chart prices for 68 commodities across four asset classes: energy, agriculture, fertilizers, and metals. It also includes indices for 182 economies, with historical data dating back to 1962. Users can easily export data directly from the charts.
For agricultural insights, the USDA Economic Research Service offers its Commodity Costs and Returns tool. This resource separates recent estimates from long-term data series and provides detailed forecasts on production costs, including organic cost data for major U.S. field crops.
The UN Commodity Trade Statistics Database (UN Comtrade) is another valuable resource, particularly for those researching bilateral trade. It organizes data using classifications like SITC, the Harmonized System (HS), and Broad Economic Categories (BEC). Users can filter by commodity, region, and time period to tailor their analysis.
Data Formats and Download Options
Government agencies provide commodity data in several formats to suit different needs:
- CSV (Comma-Separated Values): A widely used format compatible with most statistical tools and programming languages.
- Excel Databases: Ideal for those who prefer working in spreadsheet environments. For instance, the IMF offers an Excel database for Primary Commodity Prices, while the USGS provides historical mineral commodity statistics in similar formats.
- JSON Format: This format is becoming increasingly popular for API-based access, enabling real-time data retrieval and seamless integration with automated systems.
Download limits vary depending on the platform. Some portals allow bulk downloads, while others may require you to segment data by time period or commodity type. Choosing the right format and method depends on your technical skills and the scope of your analysis.
Data Extraction Best Practices
Before downloading data, take the time to review the documentation and technical specifications provided by each agency. Methodologies, units, and time conventions can differ significantly. For example, the USDA highlights that recent estimates may reflect revised accounting methods, which could lead to discrepancies when compared to earlier data.
Be vigilant for data gaps and revisions. For instance, the IMF updates its Primary Commodity Prices monthly, with the latest update on November 6, 2025. Similarly, the U.S. Bureau of Labor Statistics transitioned from daily to weekly commodity index computations in 1969, a detail that’s crucial for understanding historical trends.
If you're combining datasets from multiple sources, ensure consistency by standardizing units and currency formats. Prices might be reported in U.S. dollars, SDRs, or other units like barrels, bushels, or tons. Always document your data source, retrieval date, and any transformations applied to maintain transparency and reproducibility.
For programmatic access, tools like OilpriceAPI provide a JSON REST API, delivering both real-time and historical price data for commodities such as Brent Crude, WTI, Natural Gas, and Gold. This makes integration and analysis much more straightforward.
Government Data Sources: Pros and Cons
Government data sources come with both benefits and drawbacks, influencing their suitability for various types of analysis. Knowing these trade-offs can help you choose the right source for your specific needs.
Main Advantages
One of the biggest strengths of government data is its transparency and reliability, thanks to strict reporting standards. Many agencies have been collecting data for decades, offering rich historical datasets that are invaluable for identifying long-term trends. Plus, the best part? Most of this data is publicly available, meaning you can access high-quality information without needing a big budget.
Government agencies also excel in specific areas. For instance, the Energy Information Administration (EIA) provides detailed databases on oil, natural gas, coal, and other energy sources. Similarly, the IMF's Primary Commodity Price System offers indices and market prices for 182 economies, with data going back to 1962 and updated monthly.
But while these sources are robust, they’re not without their challenges.
Key Limitations
Government data often comes with delays and gaps. Updates are typically weekly, monthly, or even annual, meaning real-time data isn’t usually an option. For example, the USGS only updates its mineral commodity statistics once a year. This can be a hurdle for analysts or traders who need frequent updates or intraday data.
Another issue is coverage gaps. Government databases often focus on established or economically significant commodities, leaving emerging markets or niche areas underrepresented. For instance, the Bureau of Labor Statistics (BLS) stopped daily commodity index calculations back in 1969, switching to a weekly schedule instead.
Finally, inconsistent formatting between agencies can make it tough to integrate data from multiple sources into a single analysis. These limitations mean you’ll need to weigh your priorities carefully.
Data Source Comparison Table
| Provider | Update Frequency | Key Strengths | Main Limitations |
|---|---|---|---|
| EIA | Weekly/Monthly | Extensive energy coverage | Limited to energy sector |
| USDA ERS | Annual/Monthly | Detailed cost analysis | Focuses only on agriculture |
| USGS | Annual | Long historical series | Infrequent updates |
| BLS (PPI) | Monthly | Broad cross-sector coverage | Too general for niche needs |
| IMF | Monthly | Global economic perspective | Lacks detailed commodity data |
For analysts who need real-time insights, government data often falls short. That’s where commercial tools like OilpriceAPI come in handy. They provide up-to-date market information for commodities like Brent Crude, WTI, Natural Gas, and Gold through a JSON REST API.
When choosing a data source, think about how often you need updates. If you’re focused on long-term trends, government datasets offer a wealth of historical information. But if you’re working on market timing or need real-time data, you’ll likely need to pair these sources with commercial alternatives.
sbb-itb-a92d0a3
Using Historical Commodity Data in Practice
Historical commodity data plays a crucial role across various industries, from trading to supply chain management, by uncovering long-term trends and seasonal patterns.
Professional Use Cases
Financial services and trading heavily depend on historical commodity data. Professional traders and analysts use decades of price history to spot recurring patterns, seasonal shifts, and long-term cycles. Financial institutions apply this data to backtest trading strategies and stress-test portfolios under different market conditions, helping ensure their investment strategies can withstand economic downturns.
Economic research and policy analysis also rely on these datasets. Economists frequently use historical price data from sources like the Bureau of Labor Statistics (BLS) and the International Monetary Fund (IMF) to model inflation, trade balances, and economic growth. The IMF's commodity price database, which dates back to 1962, is a go-to resource for studies on how oil price shocks impact global GDP. Similarly, the Federal Reserve incorporates the BLS's Producer Price Index for commodities into its inflation forecasting.
Agriculture and supply chain management professionals turn to USDA data to predict crop prices and manage risks. Decades of USDA cost and return estimates for major U.S. crops allow producers to assess how policy changes might affect farm profitability and food prices. Supply chain managers use this data to negotiate contracts, plan inventory, and fine-tune sourcing strategies.
Risk management across industries has advanced significantly with the use of historical data. For example, the 2021 surge in global commodity prices prompted the U.S. International Trade Commission to study historical price trends from sources like the World Bank and USDA. By analyzing the price histories of corn and soybeans, the commission identified notable impacts on U.S. agricultural exports and domestic food costs, leading to policy recommendations for trade and support programs.
Mining and mineral industries benefit from the extensive USGS database, which contains data on nearly 90 mineral commodities dating back to 1900. Companies use this resource to study long-term supply and demand trends for critical minerals, aiding both industry planning and government resource allocation.
Professionals often combine multiple data sources for thorough analysis. They start by identifying key government datasets - such as the EIA for energy, USDA for agriculture, or IMF for global commodities - and downloading historical series in formats like CSV or Excel. The data is then cleaned and standardized to ensure consistency before being integrated into analysis workflows.
For those seeking a more automated approach to blend historical insights with current market data, OilpriceAPI offers a convenient solution.
Using OilpriceAPI for Data Access
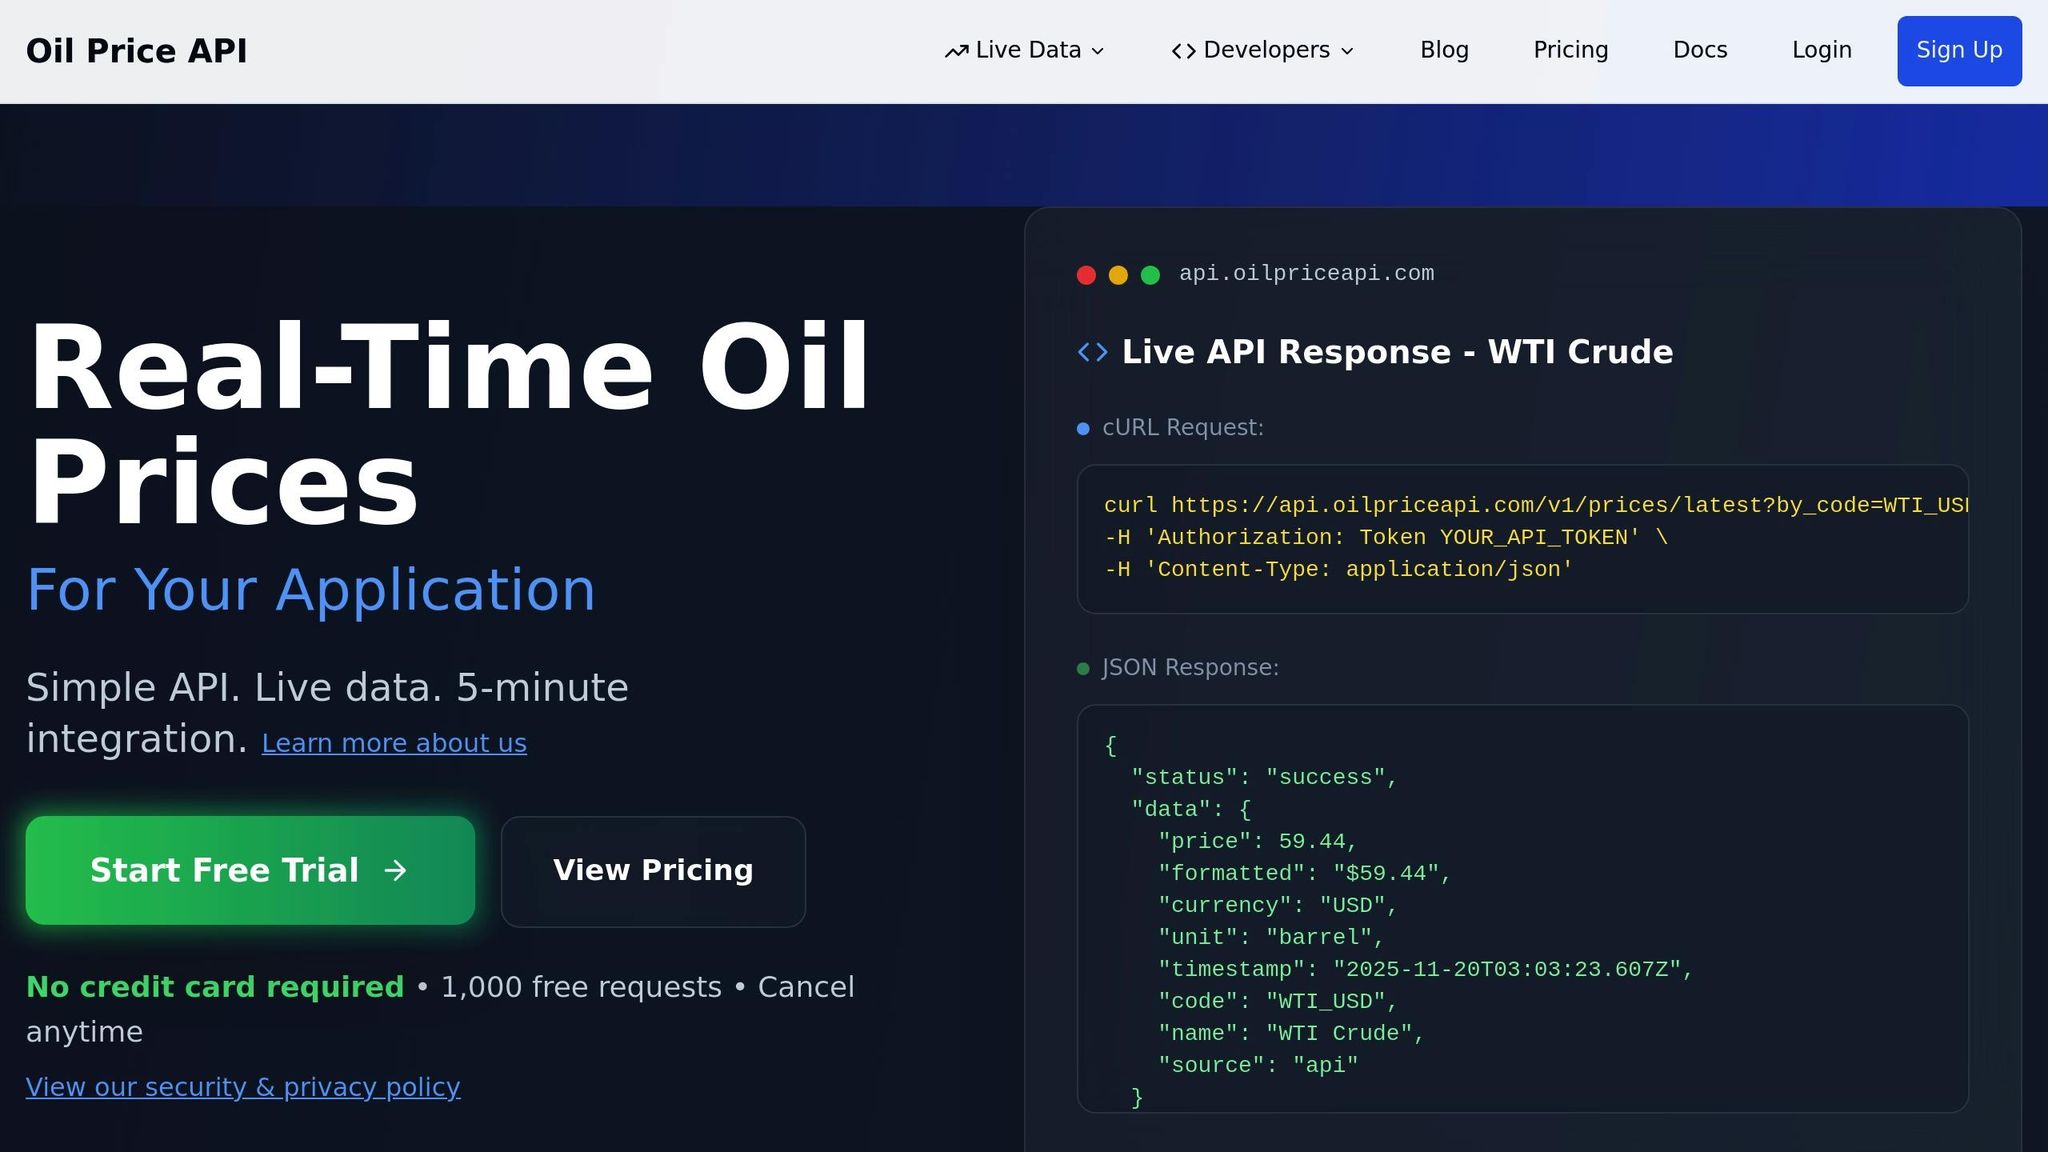
While government datasets provide extensive historical depth, pairing them with OilpriceAPI's live data enhances precision. OilpriceAPI simplifies this process by offering a JSON REST API that provides both real-time and historical price data for major energy commodities and precious metals, including Brent Crude, WTI, Natural Gas, and Gold.
The API's advantage lies in its ability to automate data retrieval. Unlike many government portals that require manual extraction and formatting, OilpriceAPI allows analysts to pull data seamlessly through simple API calls. For instance, a financial analyst can access decades of WTI crude oil price data and combine it with macroeconomic indicators for trend analysis - all within a single script or dashboard.
Professional trading applications also benefit from OilpriceAPI's features. The platform delivers reliable real-time data, enabling traders to integrate it directly into their strategies and workflows.
Supply chain and operational teams can take advantage of the platform's drilling intelligence data, such as US Rig Count and Permian Frac Spreads, to better understand supply-side factors influencing commodity prices. This insight helps companies anticipate market changes and adjust procurement strategies accordingly.
OilpriceAPI offers flexible pricing plans to accommodate different analytical needs, providing an affordable alternative to platforms like Bloomberg Terminal. Its comprehensive documentation and SDKs make integration with existing tools straightforward, enabling analysts to incorporate real-time commodity data into their models and reports without overhauling their systems.
For those needing both historical depth and up-to-date data, combining government datasets with OilpriceAPI creates a well-rounded solution. This approach provides the historical context needed for trend analysis alongside real-time market data for making informed decisions.
Getting Started with Historical Commodity Data
To dive into historical commodity data, start by leveraging reliable government data sources and pairing them with modern, automated tools. The key is understanding which agencies provide the datasets that align with your specific needs.
Begin with major government portals to establish a solid data foundation. For energy commodities, the U.S. Energy Information Administration (EIA) offers spot prices that stretch back decades. If you're looking into agricultural commodities, the USDA Economic Research Service provides cost and return estimates dating as far back as the 1920s. For mineral commodities, the U.S. Geological Survey tracks data on nearly 90 minerals, with records starting from 1900.
Additional resources like the Federal Reserve Economic Data (FRED) system and the IMF's Commodity Data Portal expand your options. They offer extensive price series and visualization tools covering 68 commodities across different asset classes.
Data Formats and Verification
Government agencies typically offer data in user-friendly formats like CSV and Excel, with some providing more technical options such as JSON or XML. Always consult the latest data releases and technical documentation to ensure accuracy. Agencies like the EIA and USDA often include metadata and revision histories, which are crucial for verifying the reliability of the data. Once the historical data is prepared and verified, integrating it with modern tools allows for seamless access to real-time insights.
The Role of APIs in Data Integration
Modern APIs simplify access to both historical and real-time data. While government datasets provide the depth of historical trends, APIs like OilpriceAPI complement this by offering real-time and historical price data for key commodities such as Brent Crude, WTI, Natural Gas, and Gold. Delivered in JSON REST format, these APIs eliminate the need for manual data extraction. They refresh data every 5 minutes and boast sub-second response times averaging 50ms.
By combining government data with API-driven tools, you can achieve a comprehensive view. Government sources provide the long-term context and verified trends, while APIs keep you updated with current market conditions. The process is straightforward: select a government source, download and standardize the data, and then integrate an API for continuous updates.
Cost-Effective Solutions
This combined approach is not only efficient but also budget-friendly. For example, OilpriceAPI offers professional-grade access starting at just $15/month, making it an affordable solution for organizations of all sizes. This makes comprehensive commodity data analysis accessible without breaking the bank.
FAQs
How can I combine government historical commodity data with real-time data for better market insights?
To build a thorough market analysis, consider merging historical commodity price data from government databases with real-time updates. Start by locating trusted government sources that provide historical pricing information for commodities like oil, gas, or gold. Next, integrate this with real-time data using a reliable tool or API.
This combination allows you to spot trends, predict price shifts, and make informed decisions. For example, comparing long-term pricing patterns with current market changes can help pinpoint potential risks or opportunities. Just make sure your data is accurate and current to ensure the most reliable insights.
What challenges come with using government sources for historical commodity data, and how can they be addressed?
Government sources often serve as dependable reservoirs for historical commodity data, but they can present a few hurdles. Issues like outdated user interfaces, delays in updates, or limited data formats can make accessing and working with this information a bit tricky. On top of that, navigating extensive datasets or pinpointing specific details can demand both time and a certain level of expertise.
To tackle these obstacles, consider leveraging tools or APIs that make accessing historical data more straightforward. Many of these tools offer user-friendly formats like JSON, which can seamlessly integrate into your workflows. By using such solutions, you can streamline your analysis and ensure you’re working with accurate, up-to-date information to guide your decisions.
How can I effectively extract and verify historical commodity price data from government sources?
To gather and confirm historical commodity price data from government sources, start by pinpointing reputable databases. Reliable options include the U.S. Energy Information Administration (EIA) for energy-related data or the U.S. Department of Agriculture (USDA) for agricultural commodities. These platforms provide detailed and trustworthy data on items like oil, natural gas, crops, and more.
When retrieving this data, make sure you're working with the most current and official versions of the datasets. It's a good idea to cross-reference this information with other credible government or institutional sources to ensure its accuracy. Pay close attention to details such as the date format (MM/DD/YYYY) and measurement units (e.g., barrels for oil, bushels for grain) to avoid any misinterpretation during analysis. For those looking to track historical price trends of major commodities like Brent Crude or Gold, tools like OilpriceAPI offer a convenient way to access reliable and up-to-date information.