How to Use MACD for Gold and Oil Trading
How to Use MACD for Gold and Oil Trading
The MACD (Moving Average Convergence Divergence) is a popular tool for trading gold and oil, helping traders identify trends, momentum, and potential price reversals. Here's what you need to know:
-
Key Components:
- MACD Line: Tracks the difference between two moving averages (12-period and 26-period).
- Signal Line: A 9-period moving average of the MACD line for smoother signals.
- Histogram: Visualizes the gap between the MACD line and the signal line, indicating momentum shifts.
-
Why Use MACD for Gold and Oil?
- These markets are highly volatile, making MACD useful for spotting trends and timing entries/exits.
- Works well in trending markets but less reliable in sideways price action.
-
Best Practices:
- Use standard settings (12-26-9) for gold; adjust for oil’s higher volatility if needed.
- Combine MACD with tools like RSI, volume analysis, and support/resistance levels to validate signals.
- Avoid relying solely on MACD in choppy markets to minimize false signals.
-
Trading Strategies:
- Look for crossovers (MACD line crossing the signal line) to identify potential buy/sell opportunities.
- Use divergences (price and MACD moving in opposite directions) to spot trend reversals.
- Monitor the histogram for early signs of momentum changes.
-
Risk Management:
- Limit risk to 1–2% of your account per trade.
- Use stop-loss orders and avoid trading during major news events.
While MACD is a powerful tool, combining it with other indicators and maintaining strong risk management is crucial for consistent results.
I Fixed MACD: Here's How to Make It Work for GOLD
Setting Up MACD for Gold and Oil Analysis
Getting the MACD (Moving Average Convergence Divergence) set up correctly is crucial when trading gold and oil. You'll need a reliable platform, settings tailored to these commodities, and accurate data to make informed decisions. Here's a closer look at how to configure MACD, fine-tune its settings, and incorporate real-time data.
How to Configure MACD on Trading Platforms
Most trading platforms include MACD as a built-in tool. For example, on TradingView, you can find it by searching "MACD" in the indicators menu. If you're using MetaTrader 4, it's located in the Navigator panel under "Oscillators." On ThinkOrSwim, head to the Studies menu and look under "Moving Averages."
For swing trades, daily timeframes work well, while shorter timeframes, like 4-hour or 1-hour charts, might help you spot intraday opportunities. However, keep in mind that shorter timeframes can produce less reliable signals. To make analysis easier, consider customizing the colors of the MACD lines and histogram for better visual clarity, especially during volatile periods.
Best MACD Settings for Commodity Trading
The standard MACD settings (12-26-9) are often effective for gold. However, oil's higher volatility might benefit from faster settings. Always backtest any changes to ensure they effectively capture trends while minimizing market noise.
Getting Real-Time and Historical Data with OilpriceAPI
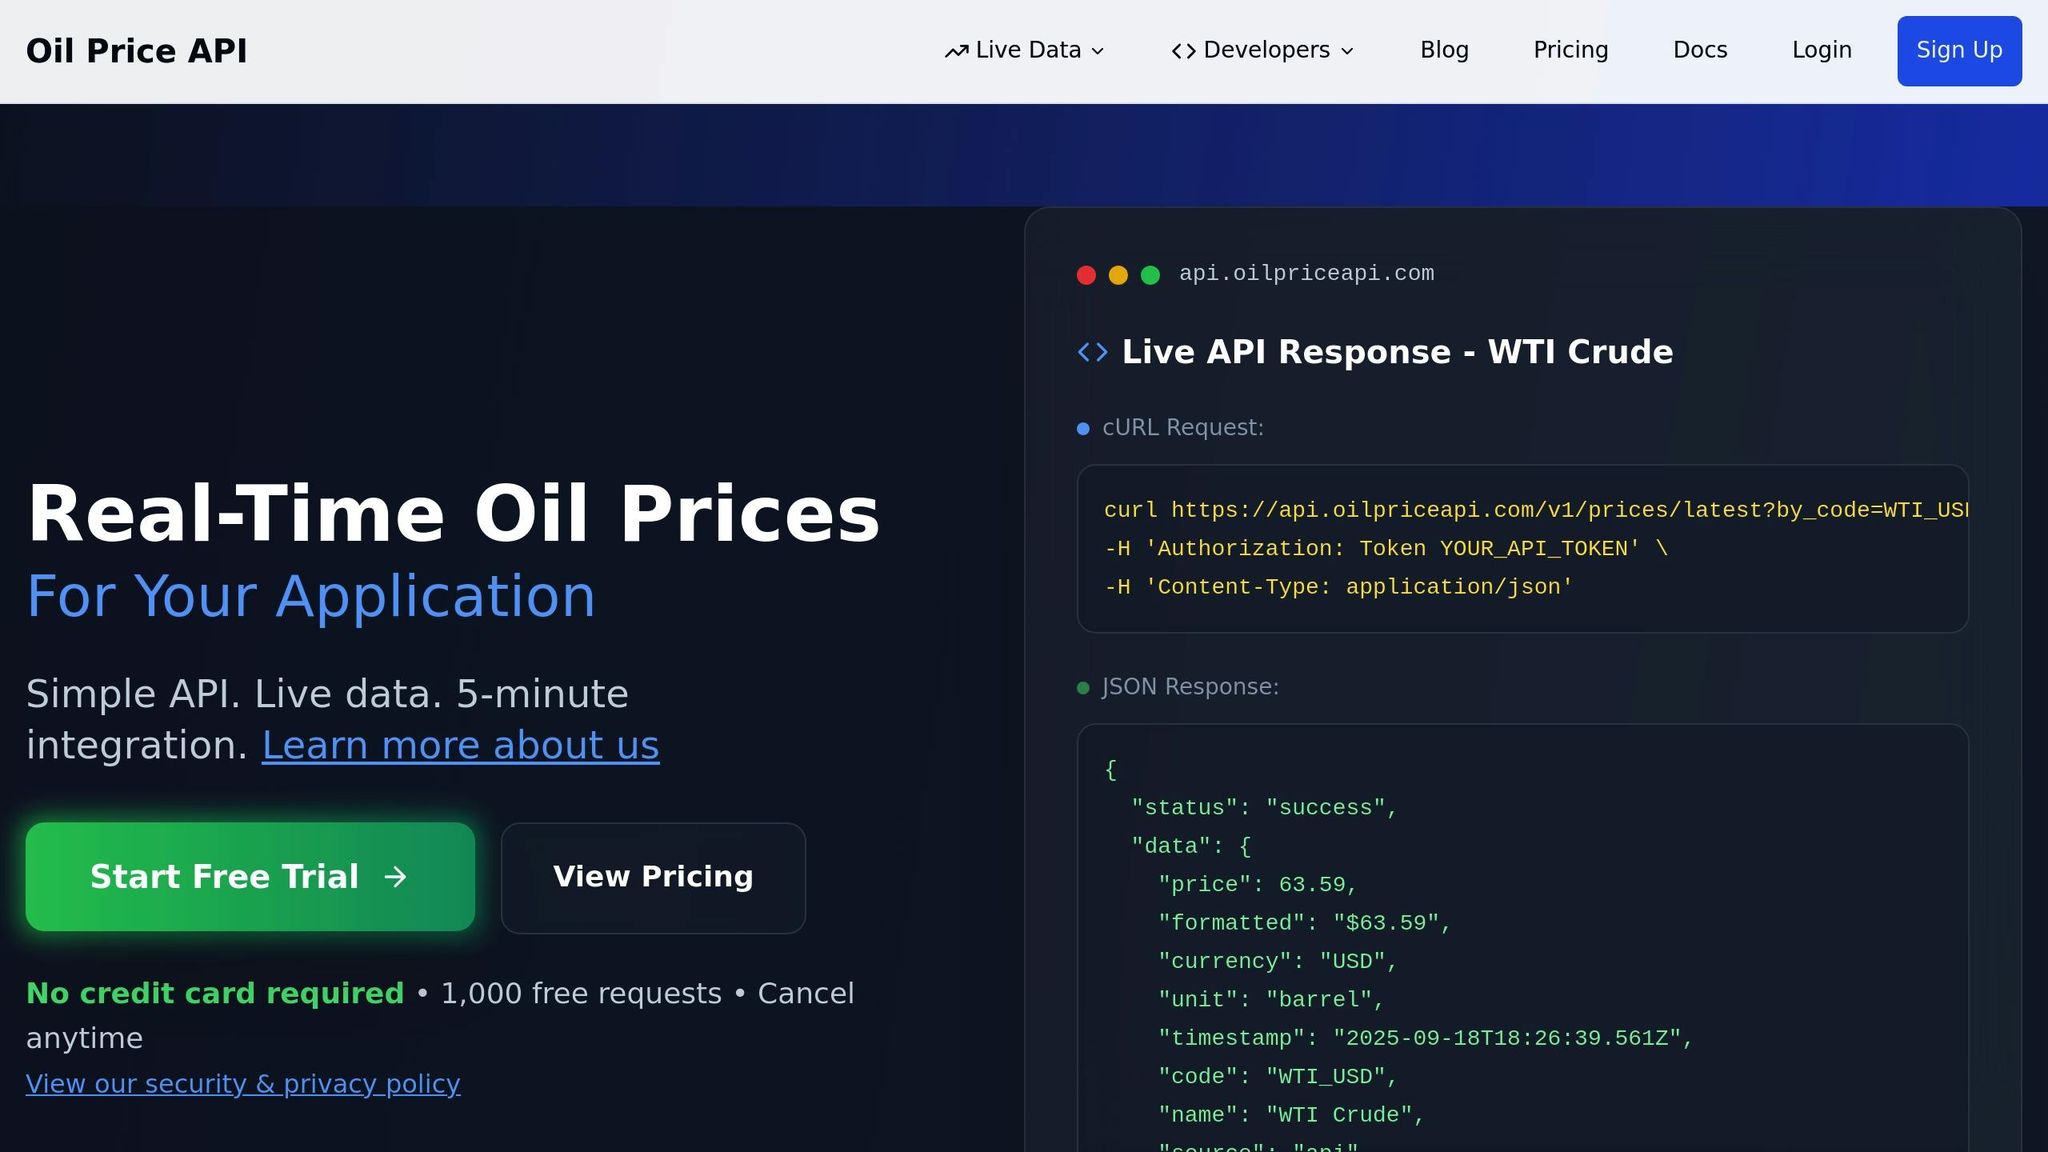
Accurate pricing data is the backbone of any successful MACD strategy. OilpriceAPI delivers real-time price updates for Brent Crude, WTI, and Gold every 1–2 minutes, with sub-second API response times. This level of frequency ensures your MACD calculations reflect the latest market movements, helping you identify crossovers and momentum shifts as they happen.
Additionally, OilpriceAPI provides up to one year of historical pricing data, accessible through endpoints like /past_month. This historical data is invaluable for backtesting your MACD strategies, allowing you to see how different settings would have performed in various market conditions.
Integration is straightforward thanks to OilpriceAPI's RESTful design and token-based authentication. The platform's documentation includes practical examples, like cURL scripts, for use in tools such as Excel, Python, or custom-built platforms. With 1,000 free requests per month and a 99.9% uptime SLA, you can automate your MACD analysis and concentrate on making smarter trading decisions.
How to Read and Interpret MACD Signals
Understanding how to properly interpret MACD signals can be a game-changer when trading gold and oil. The MACD indicator provides a variety of signals, each offering insights into market momentum and potential shifts in price direction. Let’s break down these signals and explore how to use them effectively.
Understanding Crossover and Divergence Signals
One of the most watched MACD signals is the line crossover. When the MACD line crosses above the signal line, it suggests bullish momentum, signaling potential upward movement. On the flip side, when the MACD line crosses below the signal line, it indicates bearish pressure, possibly hinting at a downward trend.
Bullish divergence occurs when the price of gold or oil makes lower lows, but the MACD shows higher lows. This pattern suggests that selling pressure is weakening and an upward reversal might be on the horizon. For instance, if crude oil prices hit fresh lows but the MACD reflects less negative momentum than during previous declines, it could mean buyers are starting to step in.
Bearish divergence works the opposite way. Here, prices reach new highs, but the MACD fails to do the same, signaling that the upward trend may be losing strength. In gold trading, bearish divergence often appears near key resistance levels, potentially foreshadowing a pullback.
The histogram is another critical element of the MACD. It measures the difference between the MACD line and the signal line. When the histogram moves closer to zero, it indicates slowing momentum, while widening bars suggest acceleration. Sharp changes in the histogram can even hint at upcoming crossovers, often one or two periods in advance.
Finally, zero line crossovers carry their own weight. When the MACD crosses above the zero line, it confirms bullish momentum, while a drop below zero signals bearish strength. These crossovers tend to be more reliable in trending markets but can generate false signals during sideways price action.
Confirming MACD Signals with Other Tools
While MACD signals are helpful, relying on them alone in volatile markets can lead to missteps, especially when the MACD and signal lines cross multiple times in choppy conditions. To improve accuracy and reduce the risk of false signals, combining MACD with other technical tools is essential.
- Volume confirmation: Pairing MACD signals with trading volume can validate the strength of a move. For example, a bullish MACD crossover accompanied by above-average volume adds credibility to the signal. In oil trading, volume spikes during MACD crossovers often reinforce the trend.
- RSI integration: Using the Relative Strength Index (RSI) alongside MACD can create powerful trading setups. A bullish MACD crossover that coincides with RSI readings below 30 (oversold) or a bearish crossover with RSI above 70 (overbought) strengthens the signal. For instance, a bullish divergence on the MACD, combined with an oversold RSI and price testing a support level, can indicate a strong buying opportunity.
- Support and resistance levels: Identifying key support and resistance zones helps add context to MACD signals. A bullish MACD signal is more convincing if prices are testing a strong support area, while bearish signals near resistance levels carry more weight.
- Moving average confirmation: Incorporating moving averages like the 50-period EMA can validate MACD signals further. For example, if the MACD indicates a bullish trend and the price is above the 50-period EMA, the likelihood of a successful trade increases.
- Price action analysis: Observing candlestick patterns, breakouts, or consolidation zones can help filter out weak MACD signals. In crude oil trading, MACD crossovers that align with breakouts from established ranges often lead to more significant price movements.
The key to success lies in building a systematic approach where multiple indicators align. While a single MACD crossover might catch your attention, combining it with tools like volume, RSI, and support/resistance levels creates a more robust and higher-probability trading strategy.
sbb-itb-a92d0a3
Trading Strategies Using MACD for Gold and Oil
MACD signals can be a powerful tool when trading gold and oil, but success depends on tailoring your approach to the unique characteristics of these markets. Gold tends to follow more consistent trends, while oil is known for its sharp volatility. Incorporating MACD into your trading requires not just technical analysis but also solid risk management.
Momentum Breakout Strategies
Pay close attention to the MACD histogram, especially during periods when it shifts from compression to expansion. This change often hints at a strong directional move. Pair MACD crossovers at key levels with price action analysis to confirm momentum before entering a trade. Since gold and oil behave differently, adjust your strategy to account for their specific levels of volatility.
Momentum strategies are designed to catch significant price moves, but they work best when balanced with reversal tactics for identifying potential market turning points.
Reversal and Trend-Following Strategies
Divergences between price movements and the MACD indicator can signal possible reversals, making them useful for managing active trades or adjusting existing positions. During strong trends, moderate pullbacks in the MACD indicator may offer opportunities to add to your positions. To refine your entries, consider analyzing multiple timeframes, and always combine MACD insights with other tools like support and resistance levels or candlestick patterns.
Risk Management for MACD-Based Trades
No trading strategy is complete without a solid risk management plan. Use stop-loss orders placed at logical support or resistance levels to protect your capital. Keep your risk per trade limited to 1–2% of your account balance, adjusting your position size to reflect the market's volatility. Stay alert to broader market events, as unexpected news can lead to sharp price movements, especially in oil markets.
MACD is a valuable tool for spotting trends and reversals, but its effectiveness grows when paired with disciplined risk controls and other technical or fundamental analysis methods.
Best Practices and Limitations of MACD in Commodity Trading
Understanding the strengths and weaknesses of the MACD (Moving Average Convergence Divergence) indicator is essential for making informed decisions in the gold and oil markets. Like any tool, MACD offers valuable insights but also has limitations that traders need to keep in mind.
Pros and Cons of MACD
MACD is great for spotting trends and gauging momentum, but it can stumble in volatile or sideways markets. Here's a closer look at its advantages and drawbacks:
| Advantages | Disadvantages |
|---|---|
| Clear trend identification - Helps pinpoint when trends are beginning, continuing, or losing steam | Lagging indicator - Signals often show up after a significant price move has already started |
| Multiple signal types - Crossovers, divergences, and histogram changes offer various entry and exit points | False signals in choppy markets - Sideways price action can lead to misleading crossovers |
| Works across timeframes - Useful for both short-term and long-term trading styles | Requires confirmation - Not reliable enough on its own for high-confidence trades |
| Momentum insights - The histogram reveals momentum shifts before they show up in price | Struggles in ranging markets - Frequent whipsaws occur when prices move sideways |
MACD tends to perform better in trending markets, where its signals are clearer and more reliable. However, in volatile conditions, it’s prone to generating false breakouts.
Tips for Better MACD Results
To get the most out of MACD in commodity trading, consider these practical tips:
- Experiment with MACD settings: While the default settings (12, 26, 9) work well for daily charts, they might not suit every scenario. For shorter timeframes, faster settings like 8, 17, 6 can provide quicker signals. For longer-term analysis, slower parameters such as 19, 39, 9 may offer better clarity. Backtesting these configurations with historical data can help fine-tune your strategy.
- Combine MACD with price action: Don’t rely on MACD alone. Use it alongside support and resistance levels, chart patterns, or candlestick formations. This combined approach increases the likelihood of successful trades by ensuring signals align with broader market context.
- Adjust for market volatility: Different commodities behave differently. Oil markets, for example, are more prone to false signals due to geopolitical events and inventory reports. Gold, on the other hand, often provides steadier MACD signals but may take longer to develop trends. During volatile periods, wait for stronger confirmation, such as aligning MACD signals across multiple timeframes or using additional indicators.
- Stay aware of market-moving events: Major announcements like oil inventory reports, OPEC meetings, or Federal Reserve decisions can disrupt technical setups. Avoid entering trades right before such events, as price movements can render your analysis irrelevant.
- Keep a trade journal: Document your MACD settings, market conditions, and trade outcomes. Over time, this journal will help you identify which combinations of settings and market scenarios yield the best results, allowing you to refine your approach.
Conclusion
The MACD indicator is a powerful tool for spotting key market trends in gold and oil trading. By identifying crossovers, divergences, and momentum shifts through its histogram, MACD helps traders navigate the timing of entries and exits - critical moves that can significantly affect profitability in commodity markets.
However, successful traders know that MACD works best as part of a broader strategy. While it offers valuable insights, the indicator has its limitations, particularly during periods of high market volatility when false signals are more likely. Combining MACD with other technical tools, price action analysis, and solid risk management practices is essential for achieving consistent results.
Customizing MACD settings for each commodity is another important step. Testing different parameter combinations and keeping track of what works under various market conditions can help fine-tune your approach over time.
Timely data is the backbone of any MACD-based strategy. Real-time data, such as that provided by OilpriceAPI, ensures your MACD calculations reflect current market conditions rather than outdated price information, giving you a more accurate picture for decision-making.
Ultimately, disciplined execution ties everything together. The most successful traders wait for clear signals, validate them with additional analysis, and always consider the larger market context before making a move. By understanding both the strengths and limitations of MACD, and adapting strategies to suit the ever-changing market landscape, traders can make more informed decisions while maintaining strict risk management.
FAQs
How can I adjust MACD settings to account for oil's higher volatility compared to gold?
To account for oil's greater price swings compared to gold, you might consider tweaking the MACD settings to faster parameters, such as 8-17-9 or 5-35-5. These adjustments help generate quicker signals and cut down on lag, making it easier to keep up with oil's rapid price movements.
In highly volatile markets like oil, using shorter EMAs (Exponential Moving Averages) allows the MACD to react faster to price shifts. This approach can help reduce false signals and enhance the precision of your trading decisions. By tailoring the MACD to these quicker settings, you can stay more in sync with oil's dynamic market behavior.
How can I reduce false signals when using MACD in sideways or non-trending markets?
When using the MACD in sideways or non-trending markets, it’s essential to minimize false signals by waiting for clear confirmation before taking action. For example, look for MACD crossovers that align with other factors, such as volume patterns or significant support and resistance levels.
To refine your analysis further, consider pairing the MACD with tools like the ADX indicator, which gauges trend strength, or Bollinger Bands, which highlight narrowing price ranges. These combinations can help reduce market noise and lead to more precise decisions in quieter trading environments.
How can I use MACD with RSI and volume to improve my trading strategy for gold and oil?
Using MACD, RSI, and volume together can add depth to your trading strategy by offering more reliable confirmation signals. Here's how they work: MACD detects trend shifts through crossovers, RSI pinpoints whether the market is overbought or oversold, and volume reveals the strength behind price movements, shedding light on market sentiment.
For example, imagine a bullish MACD crossover paired with an RSI showing upward momentum and strong volume activity. This combination could indicate a solid entry point for a trade. By aligning these tools, you can make smarter decisions and cut down on the risk of false signals, especially when trading commodities like gold and oil.