Power BI vs Excel for Oil Price Dashboards: Which Should You Use?
Power BI vs Excel for Oil Price Dashboards: Which Should You Use?
If you need a short answer, here it is: I’d use Excel for small, manual oil price tracking, and Power BI for shared dashboards that refresh on a schedule.
That choice usually comes down to four things:
- Refresh timing: Excel needs someone to open the file and refresh it. Power BI can refresh on a schedule, up to 48 times per day on Premium.
- Data size: Excel tops out at about 1,048,576 rows per sheet. Power BI is built for much larger datasets.
- Sharing: Excel is file-based. Power BI keeps one report in one shared workspace.
- Licensing: Excel is often already included in Microsoft 365. Power BI sharing may need Pro, PPU, or Premium.
If I’m doing one-off pricing checks, what-if models, or a small weekly tracker, I’d start in Excel. If I’m building a dashboard for a team, with automatic updates and user-based access, I’d move to Power BI.
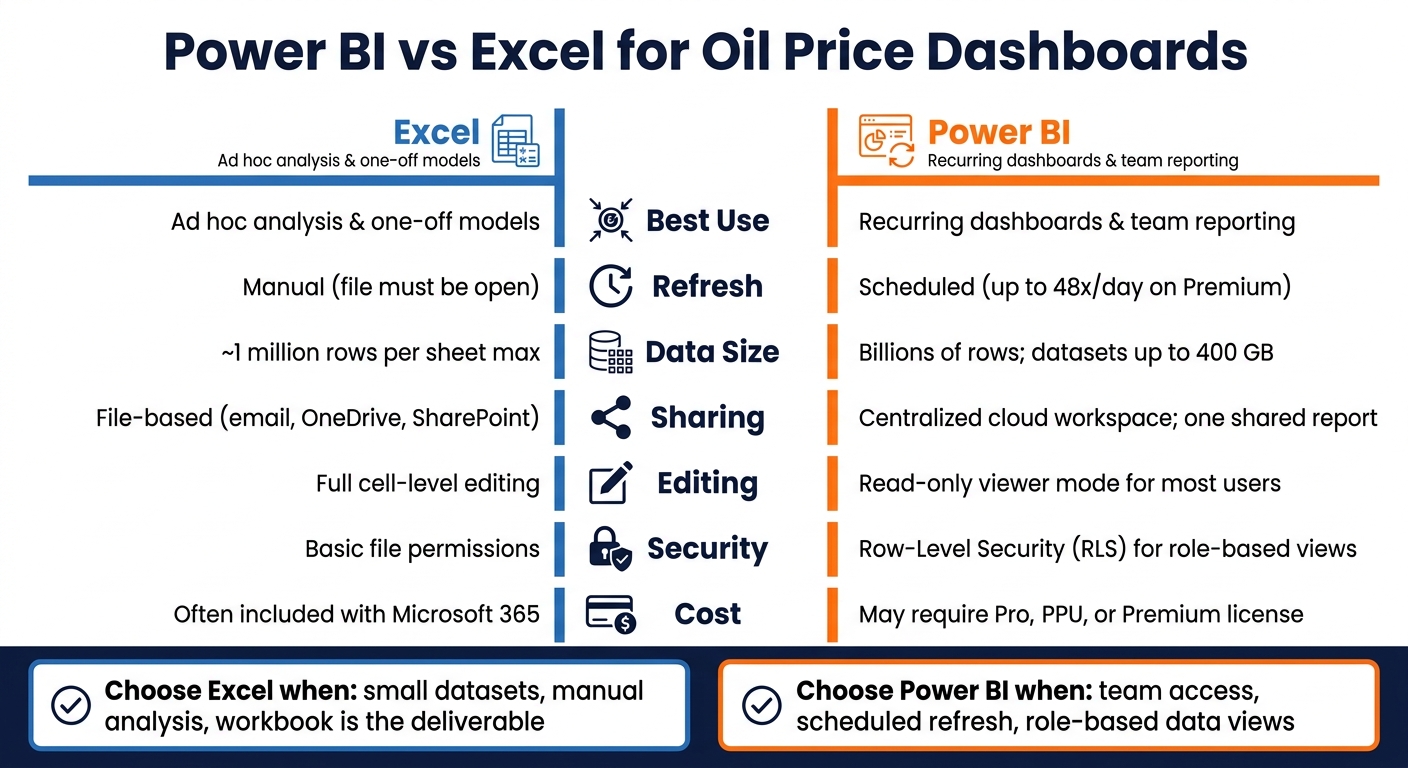
Quick Comparison
| Criteria | Excel | Power BI |
|---|---|---|
| Best use | Ad hoc analysis | Recurring dashboards |
| Refresh | Manual | Scheduled |
| Data size | About 1M rows per sheet | Very large datasets |
| Sharing | Files by email, OneDrive, or SharePoint | Shared cloud workspace |
| Editing | Full cell-level edits | Viewer mode for most users |
| Security | Basic file permissions | Row-Level Security |
| Cost | Often included with Microsoft 365 | Extra license may be needed |
So if you’re deciding between the two, I’d keep it simple: use Excel for hands-on analysis, and use Power BI when the report needs to run for a group.
Power BI vs Excel for Oil Price Dashboards: Side-by-Side Comparison
I made the SAME Dashboard in both Excel & Power BI - Here is how they compare...
sbb-itb-a92d0a3
Excel vs Power BI for oil price dashboards: the key differences
For oil price dashboards, start with three things: how often the data needs to update, how much data you're working with, and who needs to see it. If your dashboard pulls live or historical API data, those points usually decide the tool.
| Feature | Excel | Power BI |
|---|---|---|
| Refresh Behavior | Manual; file must be open | Scheduled refresh; no file to open |
| Data Volume | ~1M rows max; performance slows as row counts grow | Billions of rows; datasets up to 400 GB |
| Sharing Model | File-based sharing through email, SharePoint, or OneDrive | Centralized cloud workspaces; one shared report |
| Modeling Depth | Cell-level formulas; strong for what-if analysis | DAX-based semantic models; better for KPIs across multiple sources |
| Licensing | Included with Microsoft 365 | Requires Pro, PPU, or Premium licensing |
Refresh and update workflow
Excel works on a manual refresh model. Even if you connect Power Query to OilPriceAPI, someone still needs to open the file and run the refresh. You can patch around that with VBA scripts or Power Automate, but that setup tends to be harder to keep in shape over time. If the dashboard needs to update several times a day, that becomes a problem fast.
Power BI takes a different path. After you set up scheduled refresh, the dataset updates on its own. No one needs to open a file. No one needs to click refresh. On Premium capacities, you can refresh up to 48 times per day.
Data volume and model complexity
Excel makes sense for smaller oil price workflows and one-off analysis. It's often the easiest place to test an idea or work through a pricing scenario. But once the data starts piling up, friction shows up too. Excel has a hard cap of just over 1 million rows per sheet, and it tends to slow down as row counts climb.
Power BI is built for heavier datasets and more involved relational models. Its VertiPaq engine can work with billions of rows, with datasets up to 400 GB and a typical 10:1 compression ratio. So if you're storing long price history, joining data from several sources, or tracking KPI layers across teams, Power BI usually gives you more room to work.
Sharing, access, and licensing
Excel sharing is file-based, which sounds fine until people start emailing copies around. Then you end up with version drift, stale files, and the classic "Which one is the latest?" problem.
Power BI keeps reporting in centralized cloud workspaces, so everyone looks at the same report version. It also supports Row-Level Security (RLS), which means one report can show different slices of data to different users. That's handy when teams need access to only the numbers tied to their role or region.
For small teams doing periodic analysis, Excel's included Microsoft 365 licensing is tough to ignore. But if you need automated updates, shared access, and tighter control over who sees what, Power BI usually fits better. That's why small, manual trackers often stay in Excel, while shared dashboards tend to move to Power BI.
When Excel is the better choice for oil price tracking
Best for ad hoc analysis and lightweight dashboards
If refreshes are manual and the dataset is small, Excel is the simplest tool.
It works best for small, one-off, or free-form analysis. If you're pulling Brent and WTI prices to answer one question this week, you probably don't need a formal data model. You need a spreadsheet you can change fast.
That’s where Excel shines for ad hoc oil price work. You can pull in external price data from OilPriceAPI, combine it with your own internal cost assumptions in the same sheet, change inputs directly in cells, and run scenarios with built-in tools like Goal Seek, Scenario Manager, and Solver. For cell-by-cell scenario work, Power BI usually feels less natural.
Excel also makes sense when the workbook itself is the deliverable. If you send weekly pricing packs that need review, comments, and annotation, Excel keeps the file editable. Power BI reports are read-only for viewers. Excel is not.
In short, Excel is a good fit when you’re tracking a small set of benchmarks in a lightweight workbook. If you need automatic refresh or team-wide access, the Power BI section covers when it makes sense to switch.
Start with the Excel tutorial
If Excel matches your workflow, start with the OilPriceAPI Excel tutorial.
When Power BI is the better choice for oil price dashboards
Best for recurring reporting and team-wide access
When manual refreshes and file sharing start slowing things down, it’s time to move to Power BI. This usually happens when an oil price dashboard stops being a personal analysis tool and starts serving as a shared reporting setup for a team.
The clearest sign is scheduled reporting. Power BI supports scheduled refreshes up to 48 times per day on Premium capacity, which means your oil price data can update automatically without someone having to babysit the file.
Another big reason teams switch is Row-Level Security (RLS). RLS allows one report to show different benchmarks to different users. That’s a big deal if different teams, regions, or stakeholders need different views from the same dashboard. Excel doesn’t have a native match for that.
Before you commit, check the licensing side first. Shared dashboards may require Power BI Pro or Premium.
OilPriceAPI integration at a high level
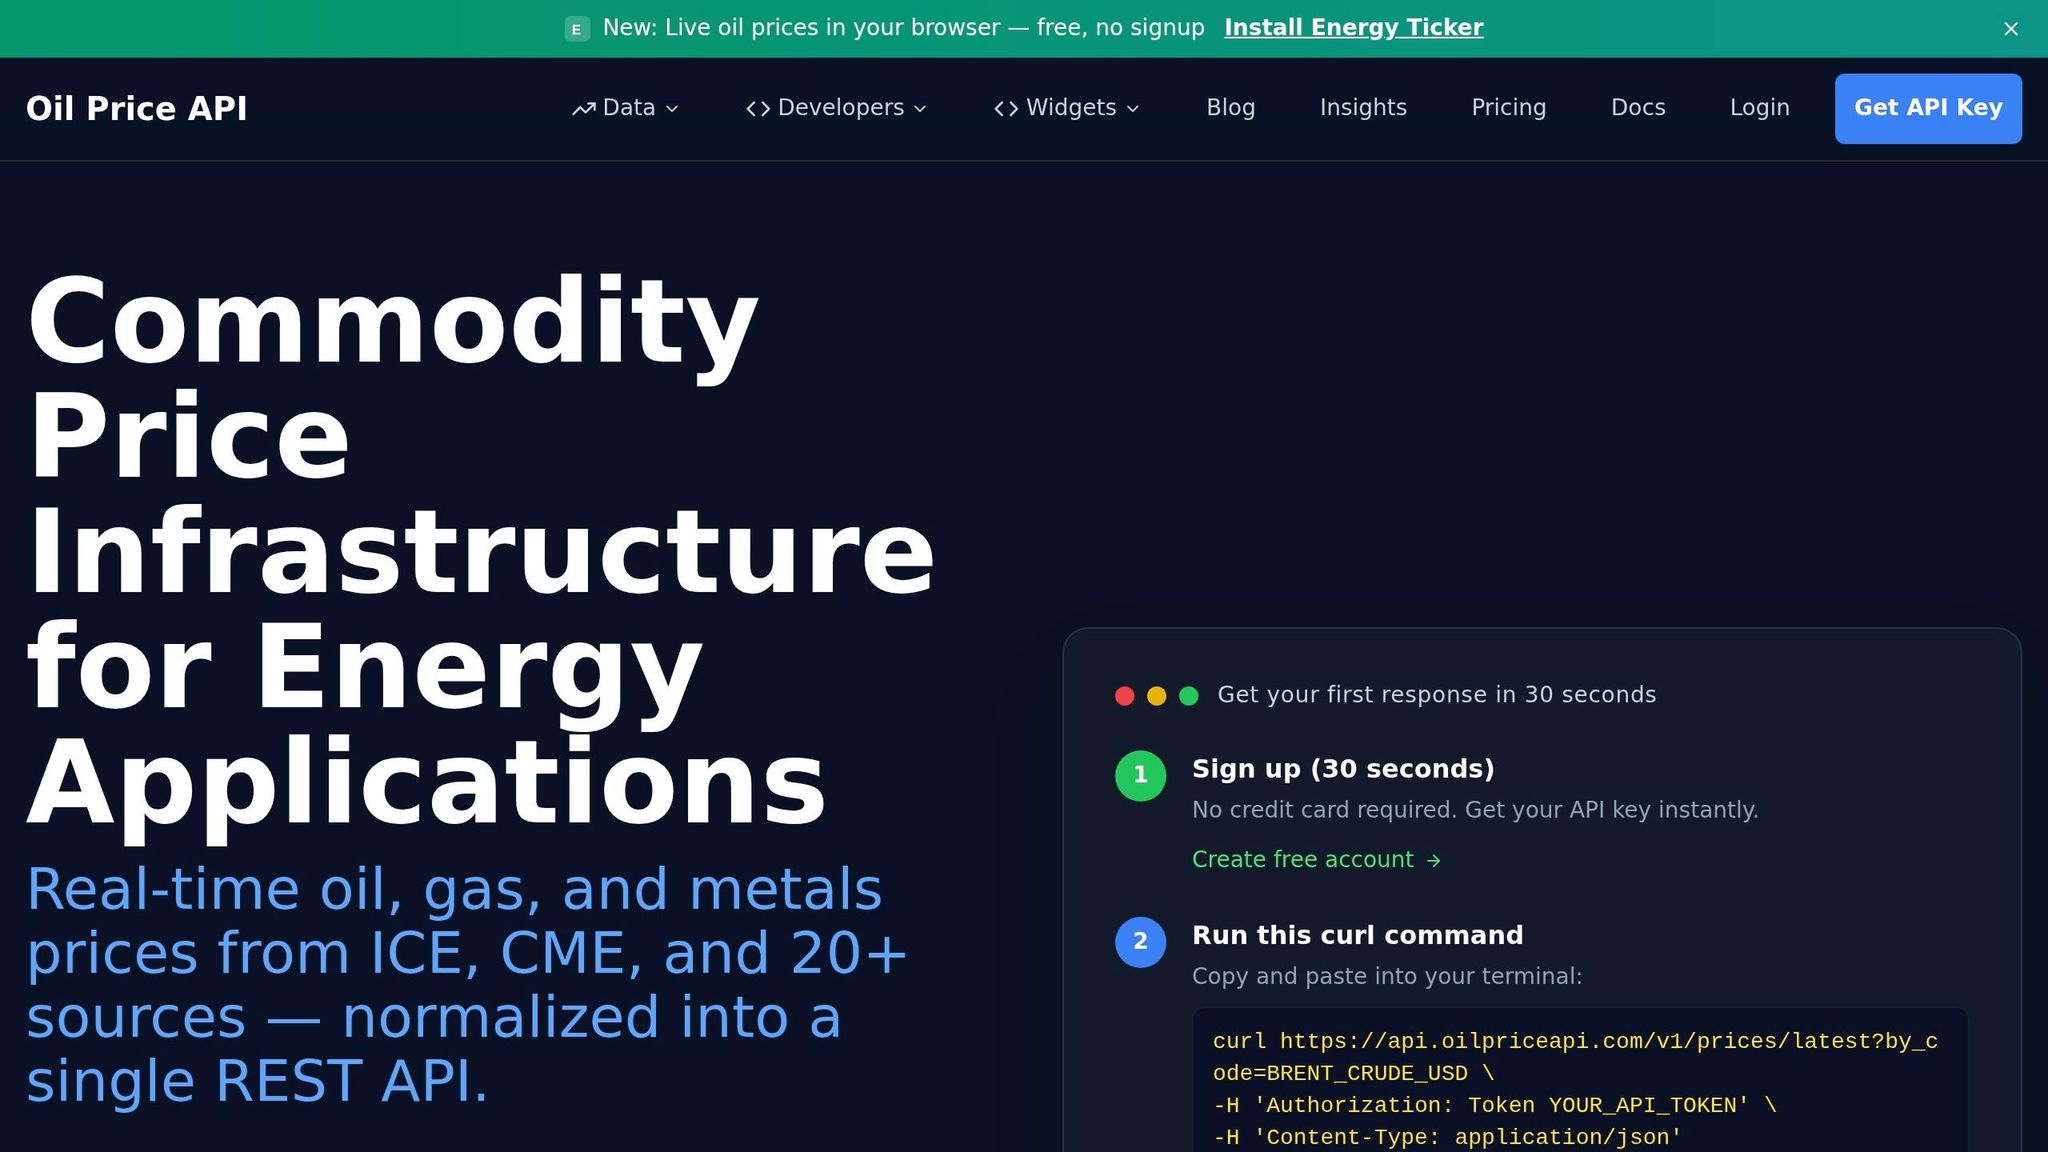
For the exact request format and Power BI integration details, see the OilPriceAPI documentation. That way, the dashboard logic stays in Power BI, while the API reference lives in one place.
Conclusion: which tool should you use?
Use Excel for small, manual analysis. Use Power BI for scheduled, shared dashboards.
Key points to remember
If you're running one-off models or light analysis, Excel is the right place to start. You get cell-by-cell control, and the workbook itself becomes the final output. If you want to pull live data from OilPriceAPI into a spreadsheet, start with the Excel oil price tutorial.
If a report needs to go to a team, refresh on a set schedule, or show different data views based on the user, Power BI is the better choice.
If your team uses both tools, Analyze in Excel helps connect them. You can link Excel to a shared Power BI dataset, keep Excel's flexibility, and still work from Power BI's governed data layer.
For setup details, see the API documentation.
Get a free API key at oilpriceapi.com.
FAQs
When should I move from Excel to Power BI?
Move from Excel to Power BI when spreadsheets start slowing you down.
A good rule of thumb: make the switch if your data grows past 500,000 to 1,000,000 rows, if you need to share interactive dashboards with a team of 10 or more, or if you want automated scheduled refreshes instead of manual updates.
Excel still makes sense for ad hoc analysis, individual financial modeling, and smaller datasets that need a bit more flexibility.
Can I use Excel and Power BI together?
Yes. Excel and Power BI often work best together.
Use Excel for ad hoc analysis, one-person modeling, and smaller data sets. Use Power BI for interactive team dashboards, automated refresh, larger data sets, and secure sharing.
What kind of license do I need to share a Power BI dashboard?
To share a Power BI dashboard, you usually need a Power BI Pro or Premium license.
Power BI is built for secure sharing through the Power BI Service. Excel, on the other hand, is better for one-off, personal analysis. If you need reporting that can scale and refresh on its own, Power BI is usually the better choice.