Weather data only helps traders when I turn it into point-in-time signals tied to the right market. In this guide, I show that the workflow is simple in concept: store each forecast run with separate timestamps, join it to commodity prices by issue time instead of valid time, map weather to the correct hub, score forecast quality with error and direction metrics, and test everything on archived data before using it live.
Here’s the short version:
- I keep issue time, target time, and observation time in separate fields to avoid look-ahead bias.
- I store weather runs and price records in an append-only log so I can rebuild what the model saw at any past moment.
- I pull commodity prices from OilpriceAPI for live quotes, history, futures curves, and stats.
- I check data age using API timestamps and stop trading a symbol if prices are more than 96 hours old and return
503 DATA_TOO_STALE. - I join weather to prices by time, location, and traded hub. For example, Permian weather should map to Waha, not a national average.
- I fix unit mismatches before modeling, such as converting RBOB and Heating Oil from USD/gallon to USD/barrel by multiplying by 42.
- I score forecast quality with MAE, RMSE, directional accuracy, and Z-scores, and I treat moves beyond ±2.0 as rare enough to flag.
- I backtest with archived forecast vintages and historical prices using point-in-time views, then send outputs into alerts, dashboards, or automated trading flows.
A few market rules stand out:
- Natural gas reacts most to heat waves and cold snaps because demand shifts fast.
- WTI and Brent react more to storms, hurricanes, and transport risk.
- Gold usually has little direct weather impact, so weather works more as a filter than a price driver.
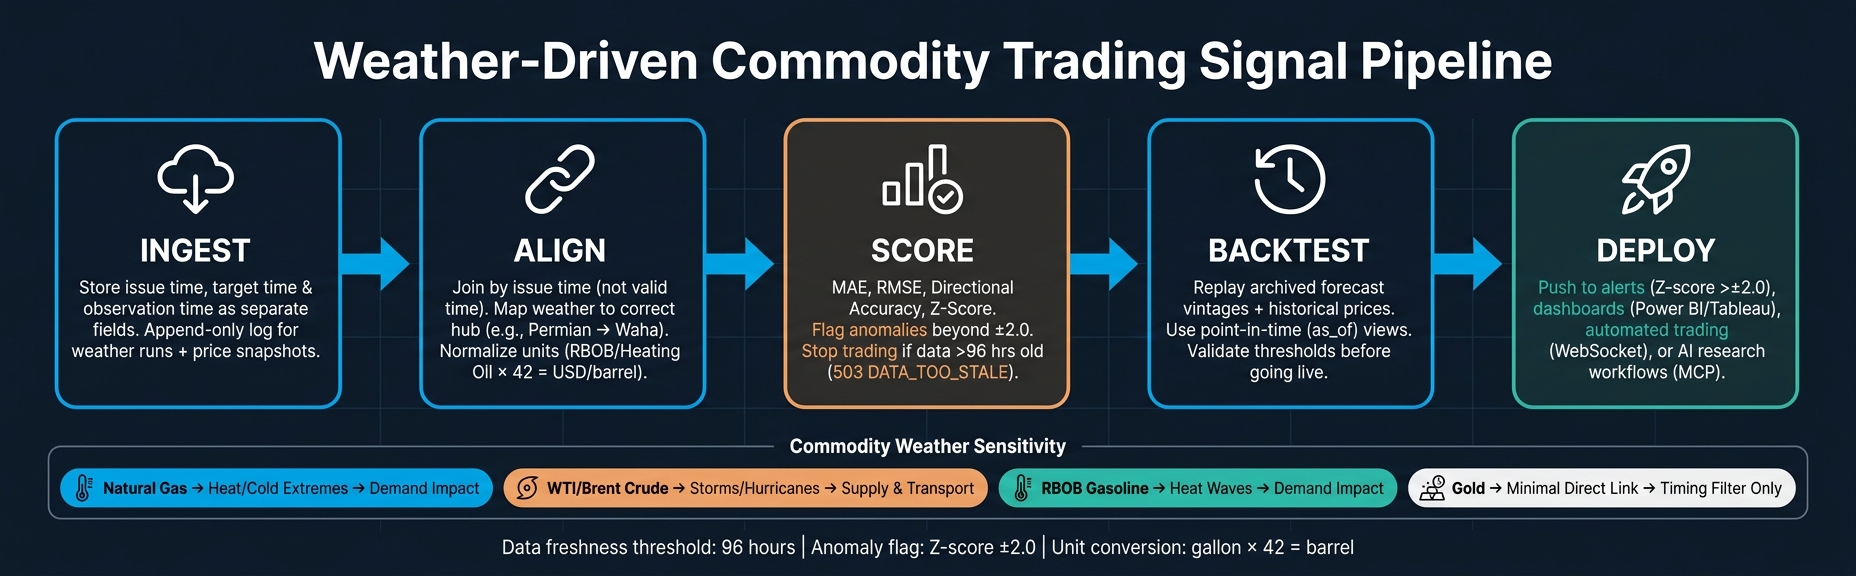
Weather-to-Trade Signal Pipeline: 5-Step Commodity Trading Workflow
What Are Weather Derivatives In Commodity Markets? - Commodity Wealth Investor
sbb-itb-a92d0a3
Quick comparison
| Commodity | Main weather link | Main market effect |
|---|---|---|
| Natural Gas | Heat and cold extremes | Demand |
| WTI Crude | Storms, hurricanes, transport issues | Supply and transport |
| Brent Crude | Marine and storm conditions | Supply and transport |
| Gold | Limited direct link | Timing filter |
If you want a weather-driven trading system that holds up in live use, this is the core process I’d follow: ingest, align, score, test, then deploy.
Build the weather and commodity data pipeline
Core architecture for ingestion, storage, and refresh
Keep forecast ingestion, normalization, and storage separate so weather runs and price snapshots line up at the exact point in time. In practice, that means each weather run and each price tick needs to be stored as its own point-in-time record.
Each record that enters the pipeline should keep three different timestamps:
- Issue time - when the forecast run was published
- Target time - the period being forecast
- Observation time - when the weather or price was recorded
A lot of teams squeeze these into one timestamp. That's a mistake. It can add look-ahead bias during backtesting and make point-in-time reconstruction fall apart later. Keep them in separate schema columns from day one.
Use an append-only log to keep every revision for both price and weather data. That makes provenance and freshness much easier to check, which matters because market data vendors sometimes revise historical records after the fact. With an append-only setup, you can rebuild exactly what the model would have seen at any moment.
Where OilpriceAPI fits in the stack
Put OilpriceAPI in the market-data layer next to weather ingestion, then write both streams into the same time-series database. Pull price data on the same schedule as the weather ingestion jobs so forecast target windows and price snapshots stay aligned.
The main endpoints cover most pipeline jobs:
| Endpoint | Use Case |
|---|---|
/prices/latest |
Real-time trading signals |
/prices/historical |
Backtesting and trend analysis |
/futures/curve |
Contango/backwardation analysis |
/analytics/statistics |
Z-score and volatility for risk scoring |
One simple tip: use separate API keys for development and production. That way, a heavy dev job doesn't burn through quota and disrupt live trading.
Once both streams live together, the next job is joining them without look-ahead bias.
Data freshness, latency, and failure handling
After you store point-in-time data, freshness becomes the next thing to watch.
Stale data breaks signals. OilpriceAPI returns created_at or updated_at ISO 8601 timestamps in every JSON response, so the pipeline can compare the source timestamp with the local system clock on each pull. If the gap is larger than your threshold, flag the record before it reaches the model.
The API also includes a stale-data cutoff. If the newest quote is more than 96 hours old, the API returns 503 DATA_TOO_STALE; stop trading that symbol until fresh data arrives, because stale prices weaken the forecast signal.
For rate limit errors (429 Too Many Requests), use exponential backoff instead of fixed retries.
Convert all timestamps to UTC ISO 8601 during ingestion, not at query time, so you don't run into alignment bugs.
Join forecasts to price data without distorting the signal
Match by time, geography, and market exposure
Join forecasts by issue time, not valid time. That way, the model only sees what was known before the trade. If a trade goes live at 10:00 AM, it can only use a forecast issued before 10:00 AM. If you join on valid time instead, you let future data slip in. That creates lookahead bias and warps the signal.
Location matters just as much. Weather should map to the hub that reflects the market you trade. West Texas should tie to Waha. The Gulf Coast should tie to the Houston Ship Channel. Once that mapping is right, you can measure how much each weather variable moves that market.
The join method should match the way your desk trades. Here’s the quick breakdown:
| Join Strategy | Accuracy | Complexity | Latency | Best Use Case |
|---|---|---|---|---|
| Daily Close Join | Low | Low | Low | Long-term trend analysis |
| Intraday (Hourly) Join | Medium | Medium | Medium | Standard algorithmic trading |
Point-in-Time (as_of) |
High | High | Medium | Backtesting and high-stakes execution |
| WebSocket Push | High | High | Ultra-Low | Real-time price alerts and HFT |
For backtests, use as_of joins to rebuild the exact data vintage available at that UTC moment. That keeps the forecast-to-price link intact before you score it.
Normalize units and calendars before modeling
Unit mismatches trip up models all the time. Gasoline (RBOB) and Heating Oil come through the API in USD/gallon, while crude oil is priced in USD/barrel. For crack spread work, multiply the gallon-based products by 42 before you run the formula or use AI models. Keep natural gas in USD/MMBtu unless the model needs an energy-equivalent conversion.
| Commodity Type | Standard API Unit | Common Trading Unit | Conversion Requirement |
|---|---|---|---|
| Crude Oil | USD/barrel | USD/barrel | None |
| Natural Gas | USD/MMBtu | USD/MMBtu | Convert only if model requires common energy basis |
| Gasoline (RBOB) | USD/gallon | USD/barrel | Multiply by 42 for crack spread calculations |
| Marine Fuels | USD/metric ton | USD/metric ton | Port-specific pricing |
You also need calendars to line up. Sync holidays, weekends, and market sessions before calculating returns or spreads. Then remove incomplete or stale series before modeling. Once units and calendars match, regional sensitivity is much easier to measure cleanly.
Apply regional market logic and score forecast quality
Map regional weather variables to commodity price sensitivity
Once your units and calendars line up, the next job is simple: connect each weather variable to the market it can actually move.
That matters because regional shocks move prices; national averages often blur the picture. A freeze-off in the Permian can blow out Waha discounts. Storms near ports can disrupt crude and marine-fuel flows. If you rely on a broad average, you can miss the signal that traders care about.
The table below links key weather inputs to the commodity exposures they affect and the hubs or ports where those signals matter most:
| Weather Variable | Commodity Exposure | Regional Hub or Port |
|---|---|---|
| Temperature (Cold) | Natural Gas, Heating Oil | Henry Hub (US), TTF (EU), JKM (Asia) |
| Freeze Risk | Natural Gas Production | Waha Hub (Permian), Houston Ship Channel |
| Hurricanes / Wind | Marine Fuels, Crude Oil | Singapore, Rotterdam, Santos |
| Temperature (Heat) | Gasoline demand | RBOB Gasoline benchmarks |
| Precipitation | Coal, Hydro Power | Newcastle (AU), Powder River Basin (US), Illinois Basin |
Use the mapped hub spread as the signal, not the national average. Once that market link is in place, you can score each forecast against the exact exposure it may shift.
Score forecasts with error and direction metrics
Not every forecast should carry the same weight. Before a weather signal turns into a trade or an alert, it needs a quality check.
Two metric types matter most: error magnitude and directional accuracy.
MAE (Mean Absolute Error) shows the average size of forecast misses. RMSE puts more weight on large misses, which helps when one bad forecast can lead to an expensive position. Directional accuracy shows how often the forecast got the move right, even when the size of that move was off.
| Scoring Metric | Best Use Case | Threshold for Action |
|---|---|---|
| MAE | General error magnitude | Baseline comparison across forecast models |
| RMSE | Penalizing large outliers | Use when tail risk matters most |
| Directional Accuracy | Trend-based signals | Set minimum hit rate before enabling alerts |
| Z-Score | Anomaly detection | > 2.0 (extremely overbought) or < -2.0 (extremely oversold) |
| Confidence Bands | Reliability filter | Sigma-1 = routine; sigma-2 = high confidence |
For anomaly detection, treat ±1 as noise. Once a reading moves past ±2.0, it becomes statistically extreme and worth flagging. Use sigma-1 for routine signals, and keep high-stakes alerts for moves outside sigma-2.
Set thresholds for action
A forecast score only helps if you decide, ahead of time, what is good enough to act on. Otherwise, every noisy blip starts to look tradable, and false positives stack up fast.
A practical setup is to flag Brent-WTI spread divergence only when it moves beyond the desk's threshold, or to flag any weather variable with a Z-score above 2.0 in a region tied to an active position. You can also weight alerts by confidence level, so forecasts with more confidence carry more weight.
Archive those thresholds, then test them against historical forecast vintages and price moves.
Backtest the strategy and deploy production use cases
Backtest with archived forecasts and historical prices
Once your thresholds are set, the next step is simple in theory and unforgiving in practice: replay the strategy against archived forecast vintages and historical prices.
The key rule is point-in-time accuracy. Your backtest needs to use the data vintage that was actually available at the forecast timestamp. If you pull revised price prints later, you muddy the results and end up grading the model with data it never had at the time.
Replay MAE, RMSE, directional accuracy, and Z-score thresholds on archived vintages. Use /v1/prices/past_year with configurable intervals (1h, 1d, or 1w) so the pricing series lines up with the cadence of your weather forecast updates. Then score signal strength with Z-scores from /v1/analytics/statistics. Access to as_of point-in-time views requires the Professional plan ($19+/month).
If the signal still holds up after backtesting, turn it into something people can act on: alerts, dashboards, or automated workflows.
Production apps for traders, analysts, and developers
A checked signal only helps if it gets to the right person fast. Here’s how the main production outputs line up with the teams that use them most:
| Tool Type | Primary User | What It Does |
|---|---|---|
| Weather-linked price alerts | Traders & Risk Managers | Fires when a Z-score crosses ±2.0 |
| Regional risk dashboards | Analysts & Management | Visualizes hub-level exposure using Power BI, Tableau, or Looker Studio |
| Automated trading workflows | Quantitative Developers | Streams data via WebSockets for automated execution |
| AI-assisted research workflows | Engineering & Research | Accesses point-in-time history and futures curves through MCP |
For production reliability, implement exponential backoff on 429 errors and cache responses server-side at 5-minute intervals to keep performance steady during traffic spikes.
Conclusion: From forecast data to trading decisions
A working commodity weather signal usually follows one path: ingest → join → score → backtest → deploy. Each step matters in production. Skip one, and the signal can weaken before it ever reaches a trading decision.
FAQs
Why does issue time matter more than valid time?
In commodity trading, issue time matters more because it gives you the exact point-in-time view you need for clean backtesting and solid data integrity. It tells you when a forecast or data point was created or revised. Valid time, on the other hand, tells you when the event itself happens.
That difference matters a lot in practice. If you use issue time, your model only sees the information a trader would have had at that moment. That helps you avoid look-ahead bias and makes sure later revisions are handled the right way instead of slipping into past decisions.
How do I map weather data to the right trading hub?
Create a clear connection between weather coordinates and the commodity’s physical delivery points. A simple way to do that is to standardize weather data by region - such as pipeline zones or storage centers - and give each one a hub ID that lines up with your trading system.
From there, use those IDs to join live weather metrics, like temperature or precipitation, with the related spot pricing data from OilpriceAPI. That gives your forecasting models a direct view of how local conditions can affect supply and demand in each market.
What should I test before using weather signals live?
Before you go live, test data validation so your input streams are accurate and dependable. Then backtest with historical data to see how the model performs without lookahead bias. Put simply, the system should use only the information that would have been available at that moment.
It also helps to run series quality checks for data completeness and freshness. On top of that, watch response times and uptime so you know the system can hold up under live trading conditions.