Most API abuse does not start with a broken request. It starts with a "normal" request pattern that suddenly looks off.
If I want to catch API usage anomalies in real time, I focus on four signals:
- rate spikes that push past normal request volume
- token misuse that burns through quota
- geo shifts where the same token appears in far-apart places
- endpoint drift when a client starts hitting different routes than usual
The core idea is simple: log requests, group them into short time windows, compare them to a baseline, then alert fast. For example, this article points to checks like more than 60 requests per 60 seconds, 80% of monthly quota used, more than 2 far-apart regions within 60 minutes, or a 3x shift in endpoint mix.
A few details matter if I want fewer false alarms:
- I segment baselines by token, account, plan tier, and endpoint group
- I keep fields like UTC timestamp, IP, country, method, status, latency, and request ID
- I watch headers such as
X-Request-Id,X-RateLimit-Remaining,X-RateLimit-Used, andX-RateLimit-Tier - I recompute baselines on a daily or weekly schedule using a rolling 30-day window
- I add cooldowns so the same alert does not fire again and again
Here’s the short version: good detection is less about fancy math and more about knowing what normal looks like for each client. Once I have that, I can spot wasteful polling, stolen tokens, quota burn, and odd endpoint use within minutes instead of after the damage is done.
This article walks through that loop, the main anomaly patterns, sample thresholds, and how I’d tune alerts over time.
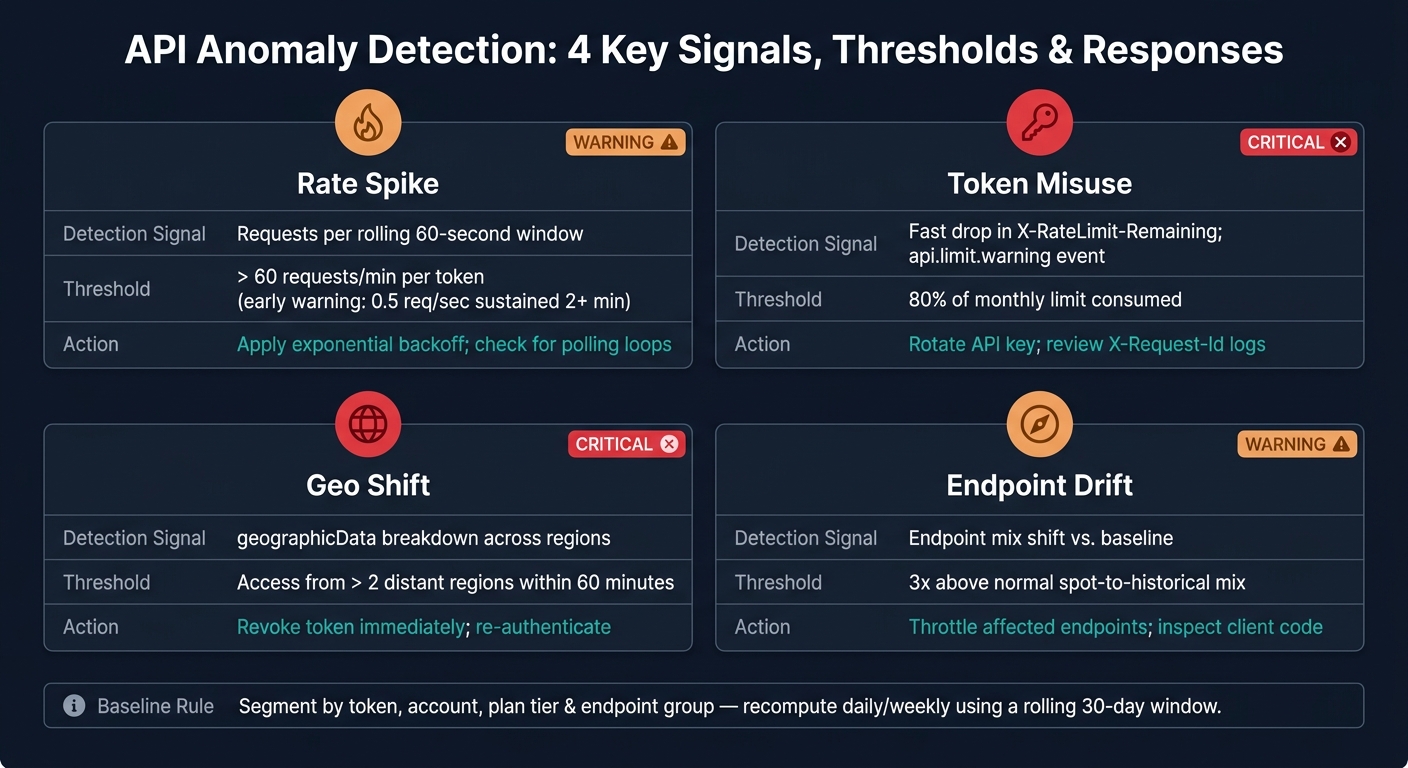
API Anomaly Detection: 4 Key Signals, Thresholds & Responses
Learned Execution Graphs for Anomaly Detection & Drift in APIs - Ritvik Pandya, JP Morgan Chase
sbb-itb-a92d0a3
2. Build a Baseline for Normal API Traffic
The compare step only works when the baseline is segmented the right way. Start with request fields that stay consistent: timestamp (UTC), endpoint path, HTTP method, status code, API token, client IP, country, and latency.
Then split that baseline by token, account, plan tier, and endpoint group. That matters because different plan tiers come with different normal volumes. If you skip that step, false positives can pile up fast.
2.1 Metrics to Track by Token, IP, Country, and Endpoint
For each segment, track request rate by minute, hour, and day. Also watch endpoint mix and geographic spread. Those signals help you spot drift before it turns into a bigger problem.
For commodity price APIs, refresh cadence matters a lot. Use it to separate normal polling from wasteful polling. Put simply, your baseline should reflect per-series update rhythms, not just raw request counts.
Keep request IDs and rate-limit headers so alerts are easier to trace. Monitor X-Request-Id, X-RateLimit-Remaining, X-RateLimit-Used, and X-RateLimit-Tier response headers. They help trace spikes and quota use.
Those metrics only help if the baseline stays current.
2.2 How Often to Recompute Baselines
Recompute baselines daily or weekly with a rolling 30-day window.
Once the baseline is in place, you can look for the four patterns that break from it: spikes, misuse, geo shifts, and endpoint drift.
3. Detect the Main Anomaly Patterns
Start with signals you can explain: rate, token spread, geography, and endpoint mix. Each pattern leaves a different trail, so each one needs a different response. Use the baseline from the previous section to flag these issues in real time.
| Anomaly Type | Detection Signal | Sample Threshold | Action |
|---|---|---|---|
| Rate Spike | Requests per rolling 60-second window | > 60 requests/min per token | Apply exponential backoff; check for polling loops |
| Token Misuse | Fast drop in X-RateLimit-Remaining; api.limit.warning event |
80% of monthly limit consumed | Rotate API key; review X-Request-Id logs |
| Geo Shift | geographicData breakdown |
Access from more than 2 distant regions within 60 minutes | Revoke token; re-authenticate |
| Endpoint Drift | Endpoint mix shift | 3x above the normal spot-to-historical mix | Throttle affected endpoints; inspect client code |
The sections below show how to use each rule in practice.
3.1 Rate Spikes and Sudden Volume Abuse
OilpriceAPI has a hard cap of 60 requests per rolling 60-second window across all plans. If a token goes past that limit, the API returns a 429 error. At that point, check error_code right away. RATE_LIMIT_EXCEEDED points to a traffic problem that backoff can fix. MONTHLY_QUOTA_EXCEEDED is different - it means the account has hit its monthly cap and needs a reset or plan upgrade.
A solid early warning mark is 0.5 requests per second, sustained for more than 2 minutes, from a single token or endpoint pair. That’s often where a bug, retry storm, or polling loop starts to show its hand. When this trips, throttle first and dig into the cause after.
3.2 Token Misuse and Geographic Shifts
If the same token shows up in multiple far-apart countries within 60 minutes, that’s a red flag for stolen credentials. The geographicData metric in the performance analytics endpoint makes this pretty easy to spot. Flag any token that appears in more than two geographically distant regions inside a 60-minute window.
Things get more serious when that geo shift happens at the same time as an api.limit.warning event at the 80% monthly usage mark. That combo can mean someone is burning through quota fast. In that case, revoke the token at once and review the X-Request-Id logs.
3.3 Endpoint Drift and Unusual Resource Access
Endpoint drift happens when usage patterns change in a way that doesn't fit the client’s normal behavior. A common example is a client that usually hits top commodity data APIs and then suddenly starts making heavy historical data pulls and then suddenly starts making heavy historical data pulls. That shift matters because historical requests can chew through quota faster than spot requests.
If historical requests jump to about 3x the normal spot-to-historical mix, inspect the client code and throttle the affected endpoints. In plain English, if the traffic mix changes that sharply, something probably changed upstream too - a bad deploy, a script gone wild, or a token being used for a job it was never meant to handle.
Next, turn these signals into alert rules and monitoring logic.
4. Turn Detection Into Real-Time Rules and Monitoring Logic
Finding anomaly patterns is only half the work. The next part is turning those patterns into rules your system can check on its own.
Each rule needs a few plain pieces:
- a scope
- a numeric threshold
- a rolling time window
- a severity level
- a response action
4.1 Example Alert Rules for Commodity Price APIs
Here’s how the four anomaly patterns map to threshold-based rules your monitoring layer can check automatically.
Tune these thresholds to match your traffic profile and plan tier, following API rate limiting best practices.
| Rule Name | Scope | Condition | Time Window | Severity | Notification Target |
|---|---|---|---|---|---|
| Rate Spike | API Key | > 36 requests/minute for 5 minutes | 5 minutes | Warning | Slack / Dashboard |
| Token Misuse | Token | Access from > 2 countries | 10 minutes | Critical | PagerDuty / Security |
| Endpoint Drift | Account | > 20% of calls hit unseen endpoints | 1 hour | Warning | Email / DevOps |
| Quota Exhaustion | Account/Token | Usage > 80% of monthly limit | 1 hour | Warning | Email / Dashboard |
Watch X-RateLimit-Remaining and X-RateLimit-Reset so you can fire alerts before the hard cap hits.
Every alert payload should include X-Request-Id, endpoint, commodity code, current value, threshold, and token or user ID. That way, the person who gets the alert has what they need right away instead of digging through logs.
4.2 Sample Monitoring Logic and Event Pipeline
Send request logs into your aggregator, compare live windows against stored baselines, and emit a structured alert when a threshold is crossed. Put simply: traffic comes in, the system checks it against known behavior, and when something looks off, it sends an event your team can act on.
Thresholds should line up with each account’s quota and plan tier. A high-usage customer and a small plan user shouldn’t be judged by the same limits.
Use a cooldown for non-critical alerts so the system doesn’t spam your team with repeats. And if you’re using webhooks, verify the X-OilPriceAPI-Signature with HMAC-SHA256 plus a timestamp check before you process the webhook.
5. Review Alerts, Tune Thresholds, and Close the Loop
When a rule fires, don’t stop at the alert itself. Trace it back to the request and check whether the threshold was too loose or too tight. Pull the X-Request-Id from the alert payload and follow that exact request through your logs. Then review what fired, why it fired, and whether the rule got it right. That review process is how the compare and respond parts of your monitoring loop get better over time.
One alert can tell you what happened in the moment. A few weeks of alerts can show you a pattern.
Look at signals like:
- latency
- timeout rate
- error rate by SDK version
- repeated retries across weeks
Those trends usually don’t show up in a single alert. They show up over time. That’s what helps you adjust thresholds for rate spikes, token misuse, geo shifts, and endpoint drift. Before you push any threshold change to production, test it in a staging workflow. And if traffic is jumpy, use a cooldown so one rough stretch doesn’t trigger the same alert again and again.
Sometimes monitoring misses a real issue. When that happens, fix the gap directly: add a metric, tighten the alert, and set a response-time target.
After you tune thresholds, write down what the team learned. Store only the fields you need for investigation: latency, timeout rate, error rate by SDK version, and X-Request-Id. Strip out API keys and authorization headers before anything is stored. In every incident runbook, record the root cause, detection time, and any rule changes that came out of the incident.
FAQs
How do I set a baseline for each API client?
Group clients into tiers like Basic, Professional, and Enterprise, then give each tier a clear request cap. That makes resource planning a lot easier and gives you a simple way to compare actual usage with the limits you expect.
You should also expose those limits in response headers such as X-RateLimit-Limit, X-RateLimit-Remaining, and X-RateLimit-Reset. These headers give clients a plain view of where they stand, which can cut down on guesswork and avoid needless retries.
Over time, adjust those baselines based on scaling rules and usage-pattern analysis. In practice, that means watching how each tier behaves, spotting spikes or steady growth, and then tuning limits so they fit demand without wasting capacity.
How can I reduce false positives in anomaly alerts?
Use tiered thresholds to sort alerts by severity. For example, set 150% traffic growth as an early warning and 250% as a critical alert. That gives your team a clearer signal instead of treating every spike the same way.
It also helps to add cooldown periods. If a jumpy metric or a price trigger keeps crossing the same line over and over, cooldowns can cut down on alert fatigue and keep people from tuning the system out.
You can tighten things up even more by pairing statistical anomalies with momentum indicators. That extra check helps confirm whether an alert is worth sending before the team gets notified.
For webhook-driven systems, idempotent handling matters a lot. Using unique event IDs can filter out duplicate processing errors that might otherwise set off false alerts.
What should I do first when a token looks compromised?
Revoke the compromised token in your OilpriceAPI dashboard right away, then rotate it.
After that, store the new token in a safe place, like environment variables or a dedicated secrets manager. Next, review your account performance analytics to check for any unauthorized activity.