Yes - but only in a shrinking role. If I boil this down, gas networks can help cut emissions only when methane leaks stay very low, low-carbon gas is used in a few hard-to-electrify cases, and utilities stop assuming gas demand will stay high.
Here’s the short version:
- Gas networks alone won’t get the U.S. to net-zero.
- Buildings are the weak spot for gas, because heat pumps and efficiency can cut demand hard over time.
- Methane leaks can wipe out much of the climate case for gas, especially when leakage moves into the 2% to 5% range.
- Hydrogen blending has narrow limits. Even a 20% blend by volume only cuts emissions by about 6% to 7% on an energy basis, while fuel costs are much higher.
- RNG and synthetic methane can fit existing pipes, but supply is tight and costs can be high.
- The money problem is big: as more customers leave the gas system, fixed pipe costs get spread across fewer people, so bills can climb.
- The main choice is simple: maintain some assets, repurpose a few, and retire others.
A few numbers make the point fast. U.S. residential and commercial gas use could fall 55% to 85% by 2050 in deep decarbonization paths. About 630,000 leaks are estimated across U.S. pipeline mains. And Henry Hub spot gas was $2.69/MMBtu on August 5, 2026, which shows how fuel prices can shift while long-life pipe costs stay in place.
If I had to sum up the article in one line, it would be this: the future of gas networks is less about keeping the whole system and more about deciding which parts still make sense.
Pathway to a Net Zero Carbon Network: A 100% Renewable Network by 2045
sbb-itb-a92d0a3
Where Current Gas Networks Fall Short
The U.S. gas system was built for a different era. It assumed demand would stay flat or keep growing, with winter heating peaks doing most of the work in sizing the system. As the economy moves toward lower emissions, that logic starts to crack. So now the big questions aren't just about pipes and pressure. They're also about retrofits, leak control, and when some assets should be retired.
How Net-Zero Pathways Reduce Future Gas Demand
The first drop shows up in buildings. Heat pumps, tighter codes, and appliance standards cut direct gas use early. Under 1.5°C scenarios, U.S. residential and commercial gas use is projected to fall 55–85% by 2050. Industry is slower to change because high-temperature process heat and chemical feedstocks are harder to electrify, but industrial gas demand still trends downward over time.
That creates a basic problem for local distribution companies, or LDCs. These utilities recover fixed network costs over long asset lives. As more residential and commercial customers electrify, fewer ratepayers are left to carry those fixed costs. The result is simple: delivery charges go up for the customers who remain on the system.
As gas demand shrinks, the main issue is no longer throughput. It's cost recovery.
Retrofit Limits in Distribution and Transmission Systems
The makeup of the U.S. gas network makes fast retrofits hard. About 97% of distribution pipelines are plastic or steel, but older cast-iron and bare-steel mains still create outsized risk. Cast iron accounts for only 2% of distribution mains, yet it is tied to 10.6% of incidents and 41% of fatalities on gas distribution systems. Replacing that older infrastructure takes time, costs a lot, and has to meet federal and state pipeline safety rules.
That means older pipes can keep both safety risk and methane losses in place. In plain terms, pipe replacement isn't only a reliability matter. It's a climate one too.
Leak control matters even before fuel switching starts.
Hydrogen blending runs into a different set of limits. Because hydrogen molecules are so small, they can increase leak rates. Hydrogen can also make some steels more brittle and wear down seals and elastomers. NREL data show that adding 20% hydrogen to plastic distribution mains at 60 psig roughly doubles gas loss rates, to about 77 ft³/mile/year. On top of that, most existing compressor stations, valves, meters, and odorization systems were not built for high hydrogen concentrations. So pushing blends higher takes engineering review, pilot testing, and regulatory approval before anything can scale.
Maintain, Repurpose, or Retire: The Core Network Decision
Each option comes with its own mix of cost, emissions, and regulatory risk:
| Option | Capex Profile | Rate Impact | Emissions Effect | Stranded-Asset Risk | Regulatory Difficulty |
|---|---|---|---|---|---|
| Maintain with upgrades | Ongoing, moderate-to-high | Rates rise as demand falls | Reduces methane leaks; modest CO₂ impact | High if assets outlast demand decline | Moderate |
| Repurpose selected segments | Targeted, sometimes high upfront | Higher specialized tariffs | Lower emissions where low-carbon gas is available | Medium; concentrated in converted assets | High; needs new standards and rate design |
| Retire/decommission parts | Falls over time; some upfront decommissioning costs | Mixed: lower long-term gas costs, short-term recovery charges | High reduction if replaced with low-carbon electricity | Managed via securitization or accelerated depreciation | High; complex customer transitions and equity concerns |
In practice, most regions will likely use a mix. Some lines may stay in service for key industrial corridors. Some segments may be converted. Others may be retired where electrification costs less. Those choices shape retrofit spending, rate design, and stranded-asset risk.
Those trade-offs show up next in retrofit costs, stranded assets, and natural gas pricing.
Methane Leakage and Hydrogen Blending: Can the Network Go Low-Carbon?
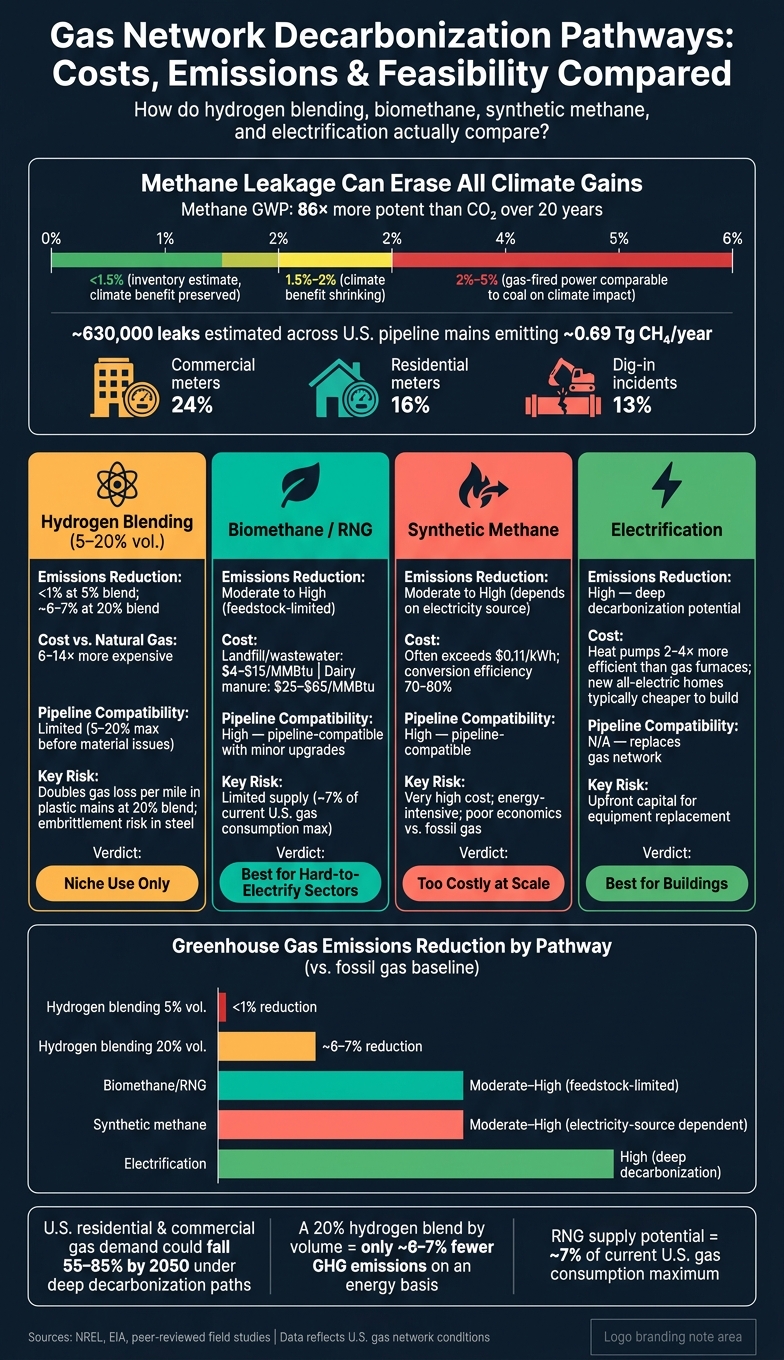
Gas Network Decarbonization Pathways: Costs, Emissions & Feasibility Compared
A gas network only helps cut emissions if it deals with leaks, keeps methane losses low, and doesn't need expensive system changes along the way. That's the first hurdle. If methane escapes at too high a rate, a lot of the climate case for gas starts to fall apart.
How Methane Leakage Can Erase Climate Gains
Natural gas emits less CO₂ than coal when burned. But that edge can shrink fast once methane leakage is counted. Methane's global warming potential is roughly 86 times that of CO₂ over a 20-year horizon, and leakage rates in the 2% to 5% range can make gas-fired power look comparable to coal over that same period.
In the United States, methane leakage estimates are all over the map. Inventory estimates sit around 1.5%. Field work paints a messier picture, with hotspot emissions at individual sites ranging from 0.65% to 66.2%. A lot of that comes from super-emitting facilities. One national ground-based study estimated that about 1.7% of methane is lost between extraction and delivery, with downstream loss rates in some regions reaching 2.7% ± 0.6%.
The distribution system adds more trouble. U.S. pipeline mains are estimated to have about 630,000 leaks, emitting around 0.69 teragrams of methane per year. At that level, the biggest sources are commercial meters (24%), residential meters (16%), and dig-in incidents (13%).
| Segment | Estimated Leakage Range | Mitigation Technologies | Regulatory Tools |
|---|---|---|---|
| Upstream | ~1–3% average; outliers up to 66% | Green completions, vapor recovery units, low-emission pneumatics | Federal performance standards, mandatory LDAR programs, venting/flaring limits |
| Transmission | Lower average; compressor stations and blowdown events can dominate | Optical gas imaging LDAR, blowdown gas recovery, real-time monitoring | Emission-intensity benchmarks, continuous monitoring at major facilities, rate-recovery conditions tied to leak reduction |
| Distribution | ~2.7% ± 0.6% in some regions; ~630,000 leaks nationally | Targeted main replacement, mobile methane detection, meter upgrades | State utility commission replacement programs, performance-based regulation, safety and emissions plans |
The big point here is simple: inventory data by itself can miss a lot. A serious decarbonization review needs measured, basin-specific leak data, not just broad system averages.
Hydrogen Blending Works Only Within Narrow Technical Limits
Hydrogen blending often gets pitched as a low-retrofit way to cut emissions. In practice, the room to work with is pretty small. Most existing U.S. distribution and transmission systems can only safely handle 5% to 20% hydrogen by volume before material and appliance issues start to show up. Transmission lines usually have even less headroom, often 5% to 10%.
And here's the catch: hydrogen has less energy per unit of volume than methane. So a 20% hydrogen blend by volume only gives about a 6% to 7% reduction in greenhouse gas emissions on an energy basis. At the same time, green hydrogen now costs 6 to 14 times more than natural gas. That's a steep price for a pretty small emissions cut.
There are also pipeline and equipment issues. In plastic distribution mains, adding 20% hydrogen roughly doubles gas loss per mile. So blending can end up increasing total leakage, which chips away at the benefit the hydrogen was supposed to bring.
That doesn't mean blending never has a role. It may fit in narrow cases, like short-term pilot projects or certain industrial clusters where other paths aren't ready yet. But for broad building decarbonization, the math is weak. Regulators should ask for strict cost-benefit review before approving blending programs funded by ratepayers.
That leaves another route on the table: pipeline-compatible renewable gases.
Biomethane and Synthetic Methane: Useful, But Only in Select Cases
Biomethane and synthetic methane can move through existing pipelines once they're conditioned to pipeline quality. In most cases, they can use the same system with little more than interconnection equipment and gas quality monitoring. So the main issue isn't whether they fit the network. It's whether there is enough supply at a price customers can live with.
U.S. organic waste streams could likely provide energy equal to about 7% of current U.S. gas consumption. Cost depends a lot on the source. Landfill gas and wastewater RNG can come in around $4 to $15/MMBtu, while dairy manure RNG can run $25 to $65/MMBtu. Synthetic methane costs even more. Optimized power-to-methane plants show conversion efficiencies of 70% to 80%, but levelized costs often go above $0.11/kWh.
These fuels can keep the network in use, but they don't remove the cost pressure on utilities and customers.
| Pathway | Emissions Reduction Potential | Technical Feasibility in Current U.S. Networks | Retrofit Needs | Indicative Cost per Unit of Energy | Key Risks |
|---|---|---|---|---|---|
| Hydrogen blending (5–20% vol.) | Low: less than 1% at 5% blends; roughly 3–7% at 20% blends | Limited; constrained by appliance limits and pipeline integrity | Appliance certification, enhanced leak monitoring, possible pipe upgrades | High: green H₂ is 6–14× more expensive than gas | Embrittlement, increased leakage, low emissions payoff per dollar |
| Biomethane/RNG | Moderate to high; feedstock-limited | High; pipeline-compatible | Interconnection facilities, gas quality monitoring | Landfill gas and wastewater RNG: $4–$15/MMBtu; dairy manure RNG: $25–$65/MMBtu | Limited supply, land-use impacts, high cost for some feedstocks |
| Synthetic methane | Moderate to high; depends on electricity source | High; pipeline-compatible | Interconnection, gas quality controls | Often exceeds about $0.11/kWh | Very high cost, energy-intensive production, poor economics vs. fossil gas |
| Electrification | High; deep decarbonization potential | Requires electric infrastructure build-out, not a gas-network solution | Building-level equipment replacement (heat pumps, electric appliances) | Heat pumps are 2–4× more efficient than gas furnaces; new all-electric homes are typically cheaper to build | Upfront capital cost for equipment replacement |
RNG and synthetic methane make the most sense in hard-to-electrify sectors like some industrial processes, heavy transport, and backup power, not everyday space heating in homes and commercial buildings. For most residential and commercial use, electrification cuts more emissions, and new all-electric homes are usually cheaper to build than homes that include gas service. Those limits matter a lot once the discussion turns to cost and rate impacts.
Cost Trade-Offs, Stranded Assets, and Natural Gas Pricing
Why Retrofit Costs Can Push Bills Higher as Gas Demand Falls
When gas demand drops, bills can still go up. That sounds backward at first, but it makes sense once you look at how gas utilities recover costs.
Gas utilities work under a regulated cost-recovery model. So the main issue isn’t whether pipe and equipment upgrade costs get paid. It’s who pays them and for how long. Those upgrades come with fixed charges that are spread across the customer base. If gas sales fall - fewer therms sold and fewer customers on the system - the same fixed costs get spread across fewer accounts.
The result is simple: per-customer delivery charges rise. And that can set off a nasty cycle. Higher bills push more households and buildings toward electrification. That shrinks the customer base again. Then rates climb again for the people who remain on gas service.
In many cases, this matters more than shifts in the commodity price itself. Wholesale gas prices get most of the headlines, but when demand is falling, the delivery charge - the fixed cost of the network - can have a bigger effect on what customers pay each month. That pressure feeds straight into stranded-asset risk.
How Stranded-Asset Risk Shapes Utility and Regulatory Planning
Gas pipelines and related assets are usually depreciated over long time frames, often decades. If climate policy, electrification, or falling demand makes one of those assets uneconomic before it’s fully paid off, the unpaid balance doesn’t just vanish. Someone still has to absorb the undepreciated cost - either investors or ratepayers.
Regulators are paying closer attention to this because unmanaged network shrinkage can hit from two sides at once. It can weaken utility finances, and it can create rate shock for customers who are still connected. Common responses include accelerated depreciation, securitization, and gas-electric integrated planning.
That’s why utilities now need transition plans built around realistic demand decline, not wishful thinking. And those choices hinge on two moving parts at the same time: the long-term drop in gas demand and the near-term path of gas prices.
What to Expect from Natural Gas Pricing Under Decarbonization
Henry Hub spot gas averaged $3.52/MMBtu in 2025, and EIA outlooks put 2026 averages between $3.20 and $3.80/MMBtu as LNG export capacity grows from 11.9 Bcf/d in 2024 to a projected 16 Bcf/d in 2026.
That price movement matters a lot for decarbonization planning. When gas prices jump, heat pumps and electrification start to look stronger on cost. When gas prices fall, gas can stay competitive for longer and slow down fuel switching.
There’s also no single U.S. breakeven point you can apply everywhere. Analysts comparing delivered gas costs in $/MMBtu with electric heating costs in $/kWh need to account for equipment efficiency. A high-efficiency heat pump can deliver several units of heat for each unit of electricity it uses, so the math changes by system, rate structure, and location.
Regional price spreads make things even messier. In West Texas, the Waha-Henry Hub spread ranged from -$10 to +$1/MMBtu in 2026, driven by Permian Basin production of 27.7 Bcf/d outpacing takeaway capacity. In areas with deeply negative basis, local gas can become cheap enough - at least for a while - to slow electrification even when national benchmark prices suggest the opposite.
For teams that need to test fuel-switching and bill-exposure scenarios, OilpriceAPI offers a JSON REST API with real-time and historical natural gas price data for scenario modeling and historical comparisons. Those local price signals often shape how fast decarbonization moves from policy into day-to-day use.
Conclusion: When Can Gas Networks Support Decarbonization Goals?
Gas networks can support decarbonization, but only in a narrow role: serving uses that are hard to electrify, keeping methane losses VERY low, and steering clear of new assets that future demand may not support. So the short answer to the headline is yes, but only for a smaller and smaller slice of demand. From there, the practical issue is figuring out which assets still make sense. That ties straight back to the maintain, repurpose, or retire framework used throughout this article.
In the U.S., gas demand is already splitting by sector. Power-sector demand is softening as solar and batteries keep growing, while other sectors are holding up more firmly. That shift changes the math. A network’s worth will depend more and more on where demand stays dense enough to support it. That’s why the best signals to watch are operational and financial, not just policy goals.
Key Metrics to Watch
No single metric gives you the whole picture. You need to look at several at once to see whether a gas network is moving toward decarbonization compatibility or drifting away from it.
| Metric | Why It Matters |
|---|---|
| Methane leakage rate | Even small leaks can wipe out climate gains from cleaner combustion |
| Share of low-carbon gases | Shows whether biomethane or hydrogen is displacing fossil gas in practice |
| Network capex per customer | Higher capex per customer can point to cost-recovery pressure as demand falls |
| Customer attrition rate | Faster customer exits squeeze the group still paying fixed system costs |
| Electrification adoption rate | Sets the pace of demand decline in residential and commercial buildings |
| Price volatility | Shows system stress, seasonal bottlenecks, and infrastructure shortfalls |
Taken together, these indicators show whether a network is shrinking, adjusting, or heading toward stranded-asset risk. Henry Hub prices ranged from $2.65/MMBtu to $9.86/MMBtu in 2025, which shows how fast market conditions can change.
Final Takeaways for Analysts, Developers, and Decision-Makers
Current gas networks can help with decarbonization only in part and only under tight conditions. Methane leakage is the deciding issue: if losses are high, most of the climate upside disappears. And hydrogen blending is still a niche path because it is costly, inefficient, and can increase leakage.
For analysts, developers, and decision-makers, the core question has shifted. It’s no longer whether gas networks can remain as they are - they can’t. It’s about which parts of the system still deliver clear economic and climate value as electrification speeds up and demand clusters in fewer end uses that are tougher to serve. At that stage, integrated gas-electric planning is no longer optional. It is the clearest way to manage costs for remaining customers and cut stranded-asset risk.
FAQs
Why is building heat the biggest challenge for gas networks?
Building heat is the biggest challenge because it drives sharp, weather-led demand swings across the year.
In winter, heating demand can jump far above normal levels. That puts pressure on storage and pipelines fast. And because this demand depends on hard-to-predict cold snaps, utilities have to keep supply steady while dealing with the price swings that come with seasonal peaks.
How much methane leakage makes gas bad for the climate?
The available sources do not give a methane leakage threshold or spell out the point at which leakage makes natural gas worse for the climate.
Instead, they stay focused on:
- market pricing
- Henry Hub benchmarks
- LNG exports
- infrastructure data
So, based on these materials alone, this question isn’t answered.
What happens to customer bills if gas demand keeps falling?
If gas demand keeps falling, customer bills will likely go up. The reason is simple: pipelines and compressor stations still cost money to run and maintain, even when people use less gas.
When fewer customers stay on the system, those fixed costs get spread across a smaller group. That pushes up the per-unit cost for the customers who remain.