When oil jumps, many EM currencies fall. That’s the short version.
I’d frame it like this: Brent surged to $138 a barrel on 04/07/2026, up from about $64 in mid-2025. When that happens, oil-importing countries often need more U.S. dollars to pay for fuel. That can push their currencies lower, add inflation, and strain FX reserves. Oil exporters may get more dollar inflows, but that does not always keep their currencies calm.
If you want the fast read, here’s what matters:
-
Net oil importers often face:
- bigger fuel import bills
- more USD demand
- weaker local FX
- more inflation pressure
-
Net oil exporters often see:
- better trade balances
- more dollar inflows
- support for public finances
- but still face FX stress if output, shipping, or policy issues get in the way
-
The biggest FX moves usually depend on:
- oil import dependence
- current-account starting point
- reserve cover
- inflation pass-through
- foreign funding needs
-
The best way to track risk is to watch:
- Brent
- WTI
- key USD/EM pairs
- the U.S. dollar
- market volatility
all in one view, on the same UTC timestamp
A simple rule I’d use: treat a 2%–3% intraday oil move, a 5% move over two to three trading days, or a break above the 20-day high as an alert. Then check whether the currency also weakens by 0.5%–1.0% vs. USD or volatility moves up.
Oil at US$100, new tariffs and a yen at a 40-year low: Barclays on what Asia faces next
sbb-itb-a92d0a3
Quick comparison
| Country type | What higher oil prices often do | FX effect |
|---|---|---|
| Net importers | Lift import costs and USD demand | Local currency often weakens |
| Net exporters | Improve trade inflows and fiscal revenue | Currency may get support, but not always |
So in plain English: I’d watch oil, the dollar, and EM FX together. When all three start moving at once, the pressure is usually no longer just about energy prices.
How oil shocks move through EM currency markets
Oil shocks usually hit EM currencies in a clear chain reaction. First comes the trade balance. Then inflation, reserves, and capital flows start to matter. And that’s where things can get messy.
The same oil spike can help one country and hurt another. Exporters may see more dollar inflows. Importers usually face bigger energy bills and more pressure on their currencies. But trade flows are only one part of the FX picture.
Net importers: higher oil bills drive dollar demand and weaken local currencies
For net importers, the problem starts fast. Higher oil prices mean bigger import bills, wider trade deficits, and more demand for U.S. dollars. That extra dollar demand tends to weaken the local currency.
Then the second hit arrives: inflation. Once the currency falls, imported fuel gets more expensive in local terms. Transport costs climb. Manufacturing costs follow. Prices start moving through the rest of the economy.
Central banks often react by tightening policy hard to defend the currency. That may steady FX markets for a while, but it can also slow growth and squeeze credit when the economy is already under strain.
Brent peaked at $138 per barrel on April 7, 2026. A move like that can put current-account pressure on importers in a hurry.
The flip side is that the same shock can support exporters - but only if production holds up and export routes stay open.
Net exporters: stronger trade balances, appreciation pressure, and policy trade-offs
Net exporters often get the first-round upside. Higher oil prices can bring in more dollars and improve the trade balance, which puts upward pressure on the currency.
Still, that support doesn’t always show up cleanly in FX markets. Production outages can cut export volumes. Fuel subsidies can eat into the gain. And if policy transmission is weak, better oil revenue may not lead to a steadier currency.
Nigeria is a good example. Its 2026 budget used $64.85 per barrel as the base case, and at the peak of the crisis the government was earning about $50 per barrel above that level. That gave the fiscal side a clear boost, but it did not automatically produce currency stability.
Stress channels that make EM FX moves worse
Trade is only the first layer. Oil shocks also tend to trigger a broader risk-off move across markets.
When investors get nervous, they often pull money out of emerging markets and shift into safe-haven assets such as U.S. Treasuries or the U.S. dollar. That outflow adds pressure to EM currencies right when trade balances are already under strain.
There’s another problem too: tighter global liquidity. When financing conditions get tougher, EM governments and companies face a harder and more expensive path to refinance dollar-denominated debt. That adds stress on top of everything else.
Ignore those risk-off flows, and you miss a big part of why EM FX moves can get so sharp.
How far a currency moves usually comes down to a few things:
- How exposed the country is to oil imports or exports
- How much reserve cover the central bank has
- How deep and liquid the local FX market is
Why some EM currencies react more sharply to oil price moves
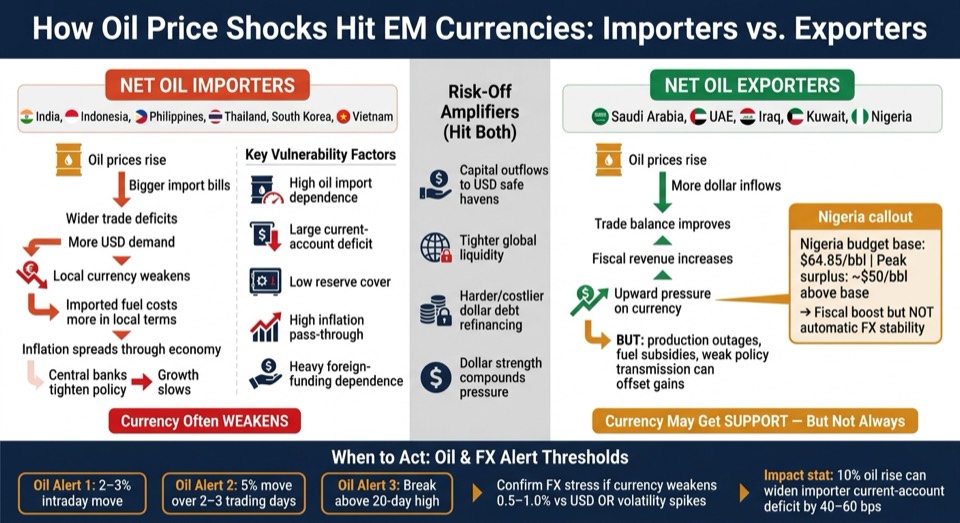
How Oil Price Shocks Hit EM Currencies: Importers vs Exporters
The same oil shock can land very differently across EM currencies. One country may see only a mild FX move. Another can get hit hard.
Why? Because importer or exporter status is only part of the story. Oil-driven FX moves also hinge on reserves, inflation pass-through, and the depth of the local market. Put simply, the size of the move comes down to exposure, reserves, and policy room.
Structural factors that determine exposure
Five factors are the most useful when ranking EM currency vulnerability:
- Oil import dependence: net imports relative to GDP or trade
- Current-account balance: the size of the deficit before the shock hits
- Reserve cover: how many months of imports central bank reserves can pay for
- Inflation pass-through: energy's share in local CPI and whether fuel subsidies are in place
- Foreign-funding dependence: how much a country leans on portfolio inflows to fund its trade gap
| Factor | Net Importers | Net Exporters |
|---|---|---|
| Trade Balance | Deteriorates | Improves |
| Dollar Funding Needs | Increases | Decreases |
| Reserve Pressure | High | Low |
Examples of exposed importers and exporter beneficiaries
That’s why analysts split countries into two groups: structurally exposed importers and oil-supported exporters.
On the importer side, common stress cases include India, Indonesia, the Philippines, Thailand, South Korea, and Vietnam. These economies share high oil import dependence, and their currencies often weaken when Brent jumps hard.
On the exporter side, Saudi Arabia, the UAE, Iraq, Kuwait, and Nigeria usually see external balances improve during oil price spikes. But Nigeria shows where the exporter story can break down: higher oil revenue did not stop pressure on the local currency.
Those same exposure markers should feed straight into Brent, FX, and volatility monitoring.
How to monitor crude prices, EM FX, and volatility in one workflow
Once you've mapped exposure, the next step is simple: watch crude, EM FX, and volatility in one live workflow.
That means following Brent, WTI, the EM currency pairs that matter most to your book, the U.S. dollar, and a stress gauge in the same place. When those pieces sit side by side, it's much easier to spot when an oil move is starting to spill into FX.
Track Brent, WTI, EM FX, and volatility in a single view
Start with the exposure ranking from the previous section. Use it to decide which pairs belong on the live dashboard.
The core view should include Brent, WTI, key EM USD pairs, the dollar index, and a market-stress gauge. For importers, focus on USD/INR, USD/PHP, USD/THB, and USD/TRY. For exporters, add USD/MXN and USD/COP.
This matters because dollar strength can either amplify or soften the FX effect of the same oil move. A jump in crude may hurt an importing economy on its own. If the dollar is climbing at the same time, that pressure can get worse fast.
It's also worth tracking intraday and multi-day moves together. Short-term swings can show the first crack. Multi-day moves tell you whether the shock is sticking. In risk-off periods, oil-FX spillovers tend to get stronger, so this side-by-side view helps you catch the shift early.
Build a single alert system for price spikes and FX stress
Once the dashboard is live, set the thresholds that trigger action.
Use an oil alert when any of these happen:
- A 2%–3% intraday move
- A 5% move over two to three trading days
- A break above the 20-day high
Then confirm FX stress only if the currency also weakens 0.5%–1.0% versus USD or volatility jumps. That extra check helps filter out noise. Oil can move on its own. The key question is whether FX is starting to buckle too.
For analysts building live monitors, line up crude, FX, and volatility data to one shared UTC timestamp. Then calculate percentage change, rolling correlation, and rolling volatility at 5-minute, hourly, and daily intervals. In reports, use U.S. date and time format. OilpriceAPI can feed Brent and WTI data straight into this workflow.
Define analyst response states when pressure rises
Not every oil spike calls for the same response. The right move depends on what else is moving with it.
| Condition | Market Signal | Analyst Action |
|---|---|---|
| Oil spike + stable USD | Supply-driven shock; EM FX moves are modest | Update inflation and import-cost assumptions; assess reserve draw risk for net importers; check whether trade balance improvements are materializing for exporters |
| Oil spike + stronger USD | Double pressure on EM importers; global financial conditions tightening | Check whether the domestic currency is underperforming peers; assess intervention probability; monitor hedging demand and offshore funding conditions |
| Oil spike + capital outflows | Risk-off environment; correlation breakdown likely | Revise current-account forecasts; evaluate reserve adequacy and burn rate; assess the risk of disorderly depreciation or emergency rate action |
When capital outflows are already showing up, tighten the thresholds. Oil shocks tend to hit EM FX hardest in stress regimes, and a 10% oil rise can widen an importer's current-account deficit by 40–60 bps.
A simple tiering system helps here: watch, warning, and stress. That gives analysts a clear way to sort signal from noise and decide what needs attention first.
Conclusion: What to watch when oil and EM FX move together
Once you’ve set exposure levels and alert thresholds, one last check matters: are crude and EM FX moving together?
Oil shocks don’t hit EM currencies the same way. Net importers usually face more dollar demand and weaker FX. Net exporters can get some trade support, but they can still get squeezed by shipping, insurance, and infrastructure risks. A lot depends on two things: how much the economy leans on oil, and how much fuel-price changes pass through to local prices.
That’s why the combined price-and-FX view is the key final check. The clearest signal shows up when crude, FX, and volatility all move at the same time. To compare those moves cleanly, use synchronized timestamps.
Direction alone isn’t enough. Context matters just as much. For live monitoring, OilpriceAPI's /v1/prices/all endpoint can pull Brent and WTI into the same workflow.
Watch crude benchmarks, FX pairs, and volatility side by side. That’s the fastest way to turn oil shocks into actionable EM risk signals.
FAQs
Why do oil price spikes hurt some EM currencies more than others?
EM currencies tend to take a bigger hit when a country is a net oil importer and has less flexible policy tools or a weaker currency setup. When global oil prices climb, local energy costs go up, inflation gets hotter, and growth often cools off.
That creates a two-sided squeeze: larger import bills and a falling currency. By contrast, countries with more flexible policies, better energy efficiency, or net-exporting status are often in a better position to absorb the shock or even gain from higher export revenue.
Can an oil-exporting country still see its currency weaken when crude rises?
Yes. Higher crude prices can boost export revenue. But an oil-exporting country’s currency can still fall if bigger economic problems cancel out that upside.
That usually happens when issues like these start to weigh on the economy:
- High inflation
- Unsustainable fiscal policy
- Structural imbalances
- Heavy dependence on other imports
- Governance and economic stability problems
In plain English, oil income helps, but it doesn’t fix everything. If investors see weak public finances, rising prices at home, or a shaky economic backdrop, the currency can still lose ground.
What signals should I watch first to spot oil-driven FX stress?
Start by watching how oil price swings line up with your target currency’s moves. In net-importing emerging markets, higher oil prices often point to inflation pressure and a weaker currency.
With OilpriceAPI, you can track daily price changes, threshold breaches, and market volatility to spot stress early.