A forward contract can have a price of $74.57 and a value of $0.00 on day one - then be worth about $6.80 per barrel a few months later. That’s the core idea: price is what you agreed to, while value is what the contract is worth today.
If I had to boil this article down fast, it would be this:
- I use cost of carry to estimate a fair forward price: spot + funding + storage - yield
- The base formula is F₀ = S₀ × e^(r + u - y)T
- After the trade starts, I mark the contract using the new fair forward price and compare it with the locked-in price
- Contango usually means funding and storage are above yield
- Backwardation usually means physical supply is tight and yield is above carry
- Oil, natural gas, and gold use the same framework but different inputs
- Good valuation depends on clean spot data, matched rate tenors, and one annual basis for all carry inputs
A few numbers make this concrete. With WTI spot at $72.00/bbl, financing at 5.00%, carry at 2.00%, and yield at 0.00%, a 6-month fair forward is about $74.57. If spot later moves to $80.00, that same long forward can be worth about $6.80/bbl. That gap drives P&L, hedge testing under ASC 815, and margin calls.
Commodity Futures Pricing Explained: Cost of Carry, Convenience Yield, and Contango vs.Backwardation
sbb-itb-a92d0a3
Quick comparison
| Market | Main carry driver | Common storage effect | Yield/lease effect | Curve pattern |
|---|---|---|---|---|
| WTI / Brent crude | Funding + logistics | Tank costs like $0.25-$0.50/bbl/month | Yield rises when inventory is tight | Often flips between contango and backwardation |
| Natural gas | Seasonality + storage tariffs | Capacity, injection, withdrawal fees | Inventory has more value near winter demand | Often shows strong monthly seasonality |
| Gold | Funding + lease rate | Vaulting often around 5-20 bps/year | Lease rate often does most of the work | Often in contango |
Bottom line: if you want to value forwards well, I separate agreed price from current value, keep carry inputs on the same basis, and treat oil, gas, and gold as different carry markets - even when the math looks the same.
Cost-of-Carry Formula and Valuation Mechanics
Forward Pricing Formula and Input Definitions
The forward price comes from five moving parts:
| Input | Symbol | What It Represents |
|---|---|---|
| Spot price | $S_0$ | Current market price for immediate delivery, quoted in USD (for example, WTI quoted in dollars per barrel) |
| Financing rate | $r$ | Annual financing rate, often proxied by U.S. Treasury yields or SOFR |
| Storage cost | $u$ | Annual cost to physically hold the commodity - tanks, insurance, compression |
| Convenience yield | $y$ | Benefit of holding physical inventory; reduces the forward price |
| Time to maturity | $T$ | Contract horizon expressed as a year fraction, such as 0.5 for six months |
These inputs turn the spot price into a fair forward price. From there, you can work out the contract's mark-to-market value.
Storage can be modeled in two ways: as a percent of spot or as explicit dollar costs spread over time. The key is consistency. Typical WTI storage costs at Cushing are about $0.10-$0.50 per barrel per month.
Here’s a simple example. If spot is $80, financing is 5%, storage is 3%, convenience yield is 1%, and time to maturity is six months, the fair forward price is about $82.85 per barrel.
$F_0 = S_0 \times e^{(r + u - y)T} = 80 \times e^{(0.05 + 0.03 - 0.01)\times 0.5} = 80 \times e^{0.035} \approx $82.85$
A useful rule of thumb: if financing and storage push up carry, the forward price tends to rise. If convenience yield rises, it pulls the forward price down.
Valuing a Forward Contract After Inception
Once the contract is live, its value can change as spot, rates, storage, or convenience yield move. For a long position at time $t$, the value is:
$V_t = (F_t - K) \times e^{-r_t(T-t)}$
Here, $K$ is the original locked-in delivery price, $F_t$ is the new fair forward price based on current market inputs, and the discount factor converts the payoff into today’s dollars.
Say a trader entered a 1-year WTI forward at $K = $82.85$. Three months later, spot has risen to $85, financing has moved to 5.5%, and convenience yield has ticked up to 2%. With 9 months left, so $T - t = 0.75$:
$F_t = 85 \times e^{(0.055 + 0.03 - 0.02)\times 0.75} = 85 \times e^{0.04875} \approx $89.24$
$V_t = (89.24 - 82.85) \times e^{-0.055 \times 0.75} \approx 6.39 \times 0.9596 \approx $6.13$ per barrel
That $6.13 per barrel is the long’s mark-to-market gain and the basis for ASC 815 fair value reporting.
At expiration, the math gets much simpler: payoff becomes $S_T - K$. So if WTI settles at $90, the long earns $7.15/bbl. If it settles at $75, the loss is $7.85/bbl.
One point matters a lot here: a higher convenience yield lowers the forward price even when spot stays the same. That can change valuation more than people expect.
These same inputs show up across commodity markets, but the mix changes by asset. Oil, gas, and gold don't carry the same way, so the pricing setup shifts with the commodity.
Contango, Backwardation, and What They Signal
Net carry, or $r + u - y$, drives the shape of the forward curve.
When financing and storage costs are greater than convenience yield, forward prices sit above spot as maturity extends. That’s contango. When convenience yield is greater than $r + u$, the curve flips into backwardation, which usually points to tight inventory and strong near-term demand.
| Market Structure | Condition | Signal |
|---|---|---|
| Contango | $r + u > y$ | Positive carry |
| Backwardation | $y > r + u$ | Scarce inventory |
| Flat | $r + u \approx y$ | Minimal net carry |
A quick example helps. If Brent is at $85 and net carry is 4%, the 1-year fair forward price is about $88.47. That matters in cash-and-carry checks, especially when traded forwards sit above fair value and storage is cheap enough to make the trade work.
That spread feeds straight into valuation inputs for oil, gas, and gold.
Commodity-Specific Carry Inputs for Oil, Gas, and Gold
Use the same cost-of-carry model, but plug in inputs that fit the commodity. The framework doesn't change. The inputs do. Oil is driven by logistics. Gas is driven by seasonality. Gold is driven by funding.
Oil: WTI and Brent Pricing, Storage, and Convenience Yield
WTI and Brent are priced in USD/bbl, but location changes the carry picture. WTI is tied to Cushing, Oklahoma, a landlocked hub where tank space is limited and pipeline flows can move local basis. Brent is tied to North Sea loadings and the economics of floating storage.
Onshore tank storage at Cushing usually costs $0.25–$0.50/bbl/month. Total carry often lands around $7–$10/bbl per year, or about 9%–13% of a $70/bbl spot price.
Convenience yield isn't quoted on a screen. You infer it from spot, carry, and the forward curve. In well-supplied markets, implied yield is often 0%–2%. In tighter markets, it can move to 5%–15%. During supply shocks, it can go above 20%. That makes sense in practice. A refiner that already has physical crude can avoid costly run cuts and hedge against pipeline problems. That insurance value is what convenience yield is pricing.
When storage gets tight and convenience yield climbs, the forward price can sit lower than plain carry would suggest.
That leaves crude pricing very sensitive to local storage conditions and physical tightness.
Natural Gas: Seasonal Storage Costs and Convenience Yield
U.S. natural gas is priced in USD/MMBtu at Henry Hub and at regional delivery points. Storage follows a clear seasonal pattern: injection from Apr. 1 to Oct. 31 and withdrawal from Nov. 1 to Mar. 31. That split has a direct effect on how each contract month is priced.
Storage tariffs usually have three parts:
- a capacity charge for reserving storage space
- an injection charge for putting gas into storage
- a withdrawal charge for taking gas out
One industry tariff example lists a capacity charge of $0.0145/dth, with injection and withdrawal charges of $0.0154/dth each. Those costs should be modeled month by month. A summer injection trade does not have the same carry profile as a winter withdrawal trade.
In gas, convenience yield is the option value of having inventory ready during peak-demand periods. When cold weather hits or regional demand tightens, gas already sitting in storage becomes much more useful. As a result, implied convenience yield for storage near constrained demand centers can move above what a national Henry Hub model would imply. That's why regional curves and basis forecasts matter. A single Henry Hub carry rate can miss winter scarcity and pipeline bottlenecks.
That seasonal setup is why gas forwards need month-specific inputs.
Gold: Spot Price, Vaulting Costs, and Lease Rate Effects
Gold is priced in USD per troy ounce and is driven more by financing and lease rates than by storage. Vaulting and custody fees matter, but they're small - usually 5–20 basis points per year. Insurance is the main storage-related cost.
Lease rate is the main force behind gold forward pricing. When lease rates rise, the forward price falls, which can push the curve toward backwardation. When lease rates stay low and USD financing costs take over, the curve usually sits in contango. The net carry rate is $(r + u - l)$, where $l$ is the lease rate. LBMA market practice uses a 360-day year for interest calculations in precious metals settlement, which matters when you annualize lease-rate inputs.
Any benefit from holding physical gold - like collateral use or access to specific bar types - is usually reflected through lease-rate dynamics and the observed basis instead of being modeled as a separate carry term. In most gold models, lease rate and financing do the heavy lifting, while custody costs stay in the background.
In gold, lease rate handles much of what storage and convenience yield handle in other commodity markets.
| Commodity | Pricing Unit | Key Driver | Storage | Yield Treatment |
|---|---|---|---|---|
| WTI / Brent | USD/bbl | Spot, financing, storage | $0.25–$0.50/bbl/month at Cushing | Inferred from curve; rises with inventory tightness |
| Natural Gas | USD/MMBtu | Seasonal spreads, injection/withdrawal costs | Month-specific capacity and variable charges | Reflects winter reliability and pipeline constraints |
| Gold | USD/troy oz | Lease rate and USD financing | ~5–20 bps/year vaulting and insurance | Absorbed into lease rate; rarely modeled separately |
Building Data Models with OilpriceAPI
A pricing formula lives or dies on the spot data and carry data behind it. Once your carry inputs are set, the next step is feeding the model with a spot-price source you can trust. OilpriceAPI delivers real-time and historical JSON data for WTI (WTI_USD), Brent (BRENT_CRUDE_USD), Natural Gas (NATURAL_GAS_USD), and Gold (GOLD_USD). Prices are quoted in USD, and each response includes the quoted unit. From there, your model can turn live prices into fair forward values.
Mapping OilpriceAPI Price Data to Valuation Inputs
The /v1/prices/latest?by_code=WTI_USD endpoint returns a JSON object with a numeric price field, a currency field, a unit field, and a created_at timestamp. That numeric price is $S_0$ in the formula.
A simple rule helps here: pull latest prices on a fixed schedule, save them in a time-series database, and run valuations from that stored snapshot. That gives you a clean audit trail and keeps one desk from pricing off a slightly different tick than another.
Historical data matters too. Endpoints like /v1/prices/past_year?by_code=WTI_USD&interval=1w let teams backtest the model and estimate convenience yield and seasonal carry.
Model Controls for Finance and Engineering Teams
Once the feed is mapped, the main job is keeping inputs clean and easy to trace. Three controls matter most.
Use the numeric price field for calculations, not the display string, and keep the unit in metadata. If units get mixed, the carry model can go off the rails fast.
Keep observable inputs apart from estimated inputs. OilpriceAPI spot prices, benchmark interest rates, and published storage tariffs are observable. Convenience yield and implied storage premia are not; you infer them from the forward curve. That split makes the model easier to audit and stress-test.
| Model Input | Source | Notes |
|---|---|---|
| Spot price $S_0$ | OilpriceAPI /v1/prices/latest |
Use the numeric price field; confirm unit, currency, and timestamp |
| Time to expiry $T$ | Contract calendar table | Compute as ACT/365 from valuation date to expiry |
| Risk-free rate $r$ | SOFR or U.S. Treasury curve | Match the tenor to contract maturity |
| Storage cost $u$ | Physical tariff quotes | Convert to an annual rate before using it in the model |
| Convenience yield $y$ | Implied from observed futures curve | Estimated; store separately from observable inputs |
Annualize all carry inputs the same way. Storage costs quoted in USD per barrel per month need to be converted to an equivalent annual rate before they go into the exponent in $F_0 = S_0 \cdot e^{(r + u - y)T}$. Gold needs the same treatment: include the lease rate or vaulting cost on the same annual basis as the financing rate. Mix monthly and annual conventions, and the forward price gets skewed.
It also helps to compare model-implied forward prices with observed market forwards or exchange-traded futures. Big gaps usually point to carry inputs that need recalibration. Once inputs are standardized, the same setup can compare oil, gas, and gold on one risk platform.
Cross-Commodity Comparison and Conclusion
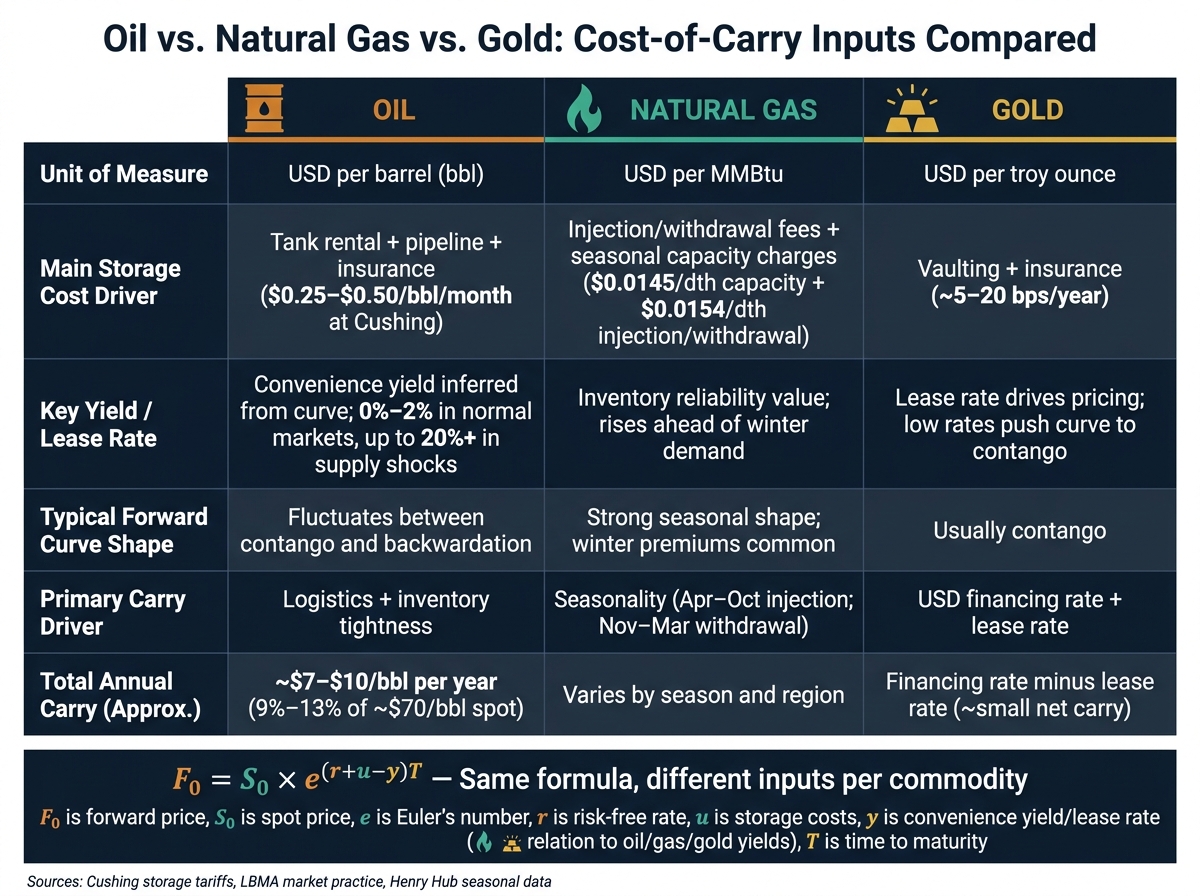
Oil vs. Natural Gas vs. Gold: Cost-of-Carry Inputs Compared
Oil vs. Gas vs. Gold: Carry Structure Compared
Once $S_0$, $r$, $u$, $y$, and $T$ are set, the hard part is picking the right carry inputs for each commodity. The formula does not change. The carry drivers do.
| Feature | Crude Oil (WTI/Brent) | Natural Gas (Henry Hub) | Gold |
|---|---|---|---|
| Unit of Measure | USD per barrel (bbl) | USD per MMBtu | USD per troy ounce |
| Main Storage Cost Drivers | Tank rental, pipeline fill, insurance, and quality or contamination risk | Injection/withdrawal fees, capacity reservation charges, and seasonal storage effects | Vaulting fees and insurance |
| Yield or Lease Rate | Inventory-driven; rises when physical barrels are scarce | Inventory reliability value; rises ahead of winter demand | Lease-rate effect; usually a small adjustment |
| Typical Forward Curve Behavior | Often moves between contango and backwardation as inventories change | Strong seasonal curve shape, with winter premiums common | Usually contango, with financing and vaulting costs outweighing lease effects |
Oil reacts the most to inventory levels. When storage gets tight, the curve can swing between contango and backwardation. Gas is shaped most by the calendar, and winter premiums show up all the time. Gold is driven more by rates, with financing and lease costs doing most of the work.
That’s where things get practical. The theory may look neat on paper, but the inputs mean very different things once you build a live model.
Key Takeaways for Valuation and Data Integration
The same formula works across all three commodities, but the input that matters most changes by market. Valuation quality drops fast when inputs get stale. Spot prices in energy markets can move intraday, and carry inputs like oil convenience yield or gas storage assumptions need to be refreshed often.
Storage costs and convenience yield are not interchangeable across commodities. Oil, gas, and gold each need their own parameter set. Use the wrong carry assumption, and you can end up giving the same input a very different economic meaning than the market does.
Use OilpriceAPI spot feeds to keep $S_0$ aligned across runs. Real-time and historical JSON feeds for Brent Crude, WTI, Natural Gas, and Gold help keep the spot input in your formula reliable across valuation runs, which is what makes commodity-specific carry models easier to defend.
FAQs
Why can a forward have a price but no value on day one?
A forward has a price on day one. That price is the amount agreed on now for payment later, and it usually comes from the current spot price plus the cost of carry, such as storage, financing, and convenience yield.
But it has no value at inception. Why? Because the forward price is set so neither side starts with an immediate profit or loss. At the moment the contract is signed, its market value is zero.
How do I estimate convenience yield if it isn’t directly quoted?
If convenience yield isn’t quoted directly, you can estimate it as the leftover piece in the cost-of-carry model.
Put simply, start with the forward pricing formula and rearrange it so convenience yield is the unknown. That means taking the spot price and adding carrying costs like storage, financing, and insurance, then comparing that total with the observed forward price.
In practice, the process is simple:
- Calculate the theoretical forward price
- Compare it with the observed forward price
- Treat the gap as the implied convenience yield
If the observed forward price comes in below the theoretical forward price, that shortfall points to a convenience yield. In other words, the market is assigning some extra value to holding the physical asset now rather than waiting to receive it later.
When should storage be modeled as a dollar cost instead of a percentage rate?
Use a fixed dollar cost when storage expenses come from physical handling and warehouse use, and those charges stay about the same no matter what the commodity is worth on the market. That’s often the case when storage is priced at a set amount, such as $X per ton per month.
Use a percentage rate when the cost moves with the commodity’s value, like insurance or some financing charges. A dollar-based input is often more precise when U.S. storage fees are quoted as currency per unit.