Mineral supply problems can push prices higher fast - and the first clues often show up in energy, shipping, and safe-haven markets.
If I had to sum up the article in plain English, it’s this: when mines get delayed, exports get restricted, or refining gets stuck in a few places, supply tightens and prices shift. That can hit spot markets first, change futures curves, and then flow into factory costs, inflation, and market positioning.
Here’s the short version:
- Mine delays keep planned copper, nickel, or lithium supply off the market.
- Export controls can cut off material almost overnight.
- Refining bottlenecks turn processing hubs into choke points.
- Policy shifts can delay new projects and change demand timing.
- Low inventories make even small disruptions hit prices harder.
- Spillovers often show up in Brent, WTI, natural gas, and gold.
- Macro signals like the DXY dollar index help separate supply stress from weaker demand.
A few data points stand out:
- Dutch TTF gas jumped 67% in days during the March 2026 LNG shock.
- The WTI-Brent spread widened to $15–$20 per barrel, versus a more normal $3–$5 gap.
- When gas moved above €55/MWh, some industrial users in Europe cut output.
For me, the main takeaway is simple: I can’t look at mineral prices alone. I need to line up event timing, price moves, freight signals, inventories, and macro data to see whether a move is a true supply shock or just part of a bigger market swing.
That’s the lens this article uses throughout.
Deploying Critical Minerals Price Support Mechanisms
sbb-itb-a92d0a3
The Problem: How Mineral Supply Constraints Begin
These constraints often start with delays, bottlenecks, or policy moves that cut supply. And once that happens, the effects can stack up fast.
Mine delays and project setbacks cut available supply
Getting a mine from discovery to full production takes years, and almost every step comes with risk. Permitting delays, cost overruns, labor disputes, and lower ore grades can all slow production. If a major copper or nickel project slips, that volume simply doesn't reach the market on time.
Buyers that were counting on that supply then have to adjust. In mining, even a timing gap matters. Planned tonnage stays off the market, near-term supply gets tighter, and the first signs usually show up in the spot market. Supply gets harder to find, and prices move up.
Export controls and refining concentration create chokepoints
Even when ore is available and mines are running, the material still needs to be processed and shipped. That's where export controls and refining concentration can turn into major chokepoints.
If a government restricts exports, material can become unavailable to most buyers almost overnight. And when refining is clustered in just a few hubs, any disruption can hit access fast, because that infrastructure takes years and billions of dollars to build. Once processing or shipping is blocked, the price effect doesn't stay local. It spreads beyond the original source region.
The same pattern shows up when policy, not geology, limits access.
Policy changes shift investment signals and demand timing
Policy can tighten supply even without export bans or mine closures. Royalty changes, tax credits, and permitting rules can delay final investment decisions and push new supply years out. Policy can also slow investment and shift demand timing, which creates a mismatch between planned supply and actual consumption.
That gap narrows future mineral availability. To spot the price effect early, analysts need to track these constraints alongside prices, volatility, and market spillovers.
How Supply Constraints Lead to Price Shifts and Market Spillovers
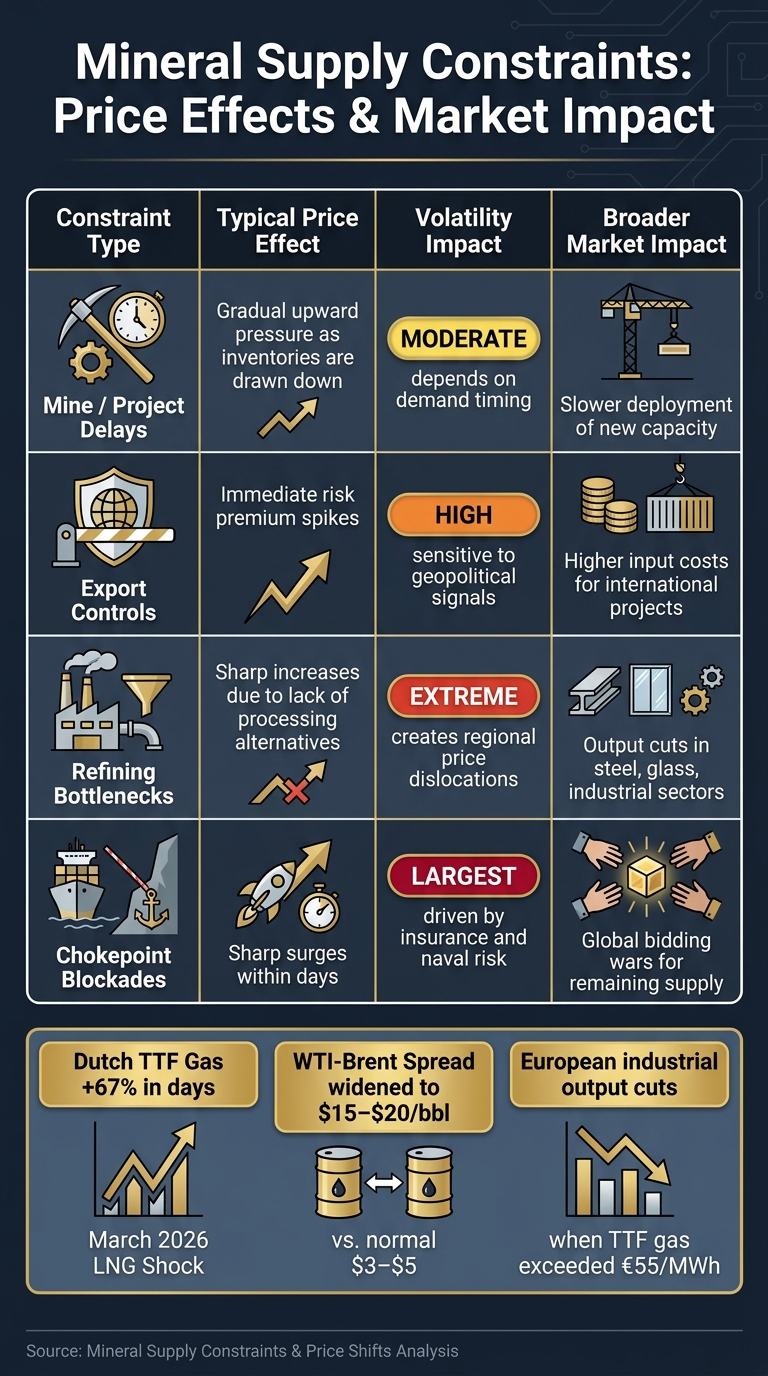
Mineral Supply Constraints: Price Effects & Market Impact at a Glance
Once supply gets tighter, the next thing you usually see is repricing. Then the spillovers start.
Why tight supply raises prices and volatility
When supply tightens, low inventories leave almost no room for error. Even a small shortfall can push prices around fast. You see the same setup in mineral markets when a mine, smelter, or shipping route runs into trouble.
Energy markets show this pricing pattern very clearly. Supply shocks can reprice risk almost at once. The March 2026 LNG crisis is a good example: a supply shock pushed Dutch TTF up 67% in a matter of days as traders priced in a longer outage. That wasn't just a simple gap between supply and demand. It was a risk premium added to the price, based on fears that the crisis would last longer than first expected.
Strong demand makes the move even bigger. When buyers are already fighting over limited supply, it doesn't take much disruption to move prices hard.
Knock-on effects in energy, inflation, and portfolio positioning
Supply shocks rarely stay in one lane. They move into energy costs, factory input costs, and then into inflation.
Energy-heavy industries usually get hit first. Chemical, steel, and glass makers can see their costs jump almost at once when energy prices spike. When TTF gas moved above EUR 55/MWh, industrial users in Europe cut output or furloughed workers. That's a direct hit to production, and it shows how fast a commodity shock can drag on the real economy.
The next step is inflation and investor positioning. Energy price swings feed straight into Consumer Price Index calculations, which can push inflation expectations higher. Portfolio managers often react by adding fuel hedges and shifting part of their exposure into gold as a safe haven.
Regional spreads can also widen in ways analysts need to watch closely. During the 2026 crisis, the WTI-Brent spread widened to $15–$20 per barrel, far above the usual $3–$5 discount. That kind of gap helps show where supply pressure is building and which markets are still more insulated.
Constraint types, price effects, and broader market impact: a comparison
Different supply constraints hit markets in different ways, and they don't all move at the same speed. Here's the usual pattern.
| Constraint Type | Typical Price Effect | Volatility Impact | Broader Market Impact |
|---|---|---|---|
| Mine/Project Delays | Gradual upward pressure as inventories are drawn down | Moderate; depends on demand timing | Slower deployment of new capacity |
| Export Controls | Immediate risk premium spikes | High; sensitive to geopolitical signals | Higher input costs for international projects |
| Refining Bottlenecks | Sharp increases due to lack of processing alternatives | Extreme; creates regional price dislocations | Output cuts in industrial sectors (e.g., steel, glass) |
| Chokepoint Blockades | Sharp surges within days | Largest; driven by insurance and naval risk | Global bidding wars for remaining supply |
That's why event tracking and live price monitoring matter so much.
The Solution: How Developers and Analysts Can Track These Shifts
Build a monitoring framework around events, prices, and macro signals
Different constraints move on different timelines. A mine delay can build over weeks or months. An export control can hit the market almost at once. So your monitoring setup needs to watch both the slow burn and the sudden jolt.
Start by linking event timestamps to price reactions. Pair supply-side events with inventory signals like the weekly EIA petroleum stock reports and Cushing levels, macro indicators like inflation and the DXY U.S. dollar index, and cross-commodity prices. That extra context matters. When the dollar gets stronger, commodity demand often cools off. That helps you tell the difference between a supply shock and a move driven by weaker demand.
Once the event is time-stamped, match it to the first markets that react. That’s often where the clearest signal shows up.
For chokepoint risk, AIS traffic near key routes adds a freight signal. Shipping disruptions along mineral supply corridors can help analysts spot supply chain cascades as they start to form.
After mapping the mineral event, track the spillover assets that move first: Brent, WTI, natural gas, and gold.
Use OilpriceAPI to track energy and safe-haven spillovers
Energy costs, inflation expectations, and investor positioning are often the first places a mineral disruption shows up outside the mineral market. OilpriceAPI offers a JSON REST API with real-time and historical access to price data for Brent Crude, WTI, Natural Gas, and Gold. For analysts running event studies, timestamped JSON responses make it much easier to tie a policy change or outage to a measured price move.
You can use the API in a few practical ways:
- Alerts: Set automated threshold triggers for dashboards.
- Event studies: Pull historical data around past disruption events to measure market reaction.
- Cross-asset risk checks: Compare WTI and Gold side by side to see whether a spike is energy-specific or part of a broader risk-off move.
For scenario models, historical pulls around earlier disruption events can also help stress-test how a similar shock could ripple through today’s market.
Data inputs and analytical use cases: a capability overview
Use these inputs to separate a true supply shock from a broad macro move.
| Data Input | Indicator Type | Common Analytical Use Case |
|---|---|---|
| Brent / WTI Crude | Price Signal | Spillover analysis; correlate mineral disruptions with global energy sentiment |
| Natural Gas | Energy Substitution | Track industrial input cost shifts when gas prices spike |
| Gold Prices | Safe-Haven Signal | Monitor macro risk appetite during supply shocks |
| Event Timestamps | Attribution | Link mine delays or policy shifts to specific daily or intraday price moves |
| Inflation / FX (DXY) | Macro Signal | Assess how currency strength and inflation pressure feed into commodity demand |
| AIS Ship Traffic | Freight Signal | Detect chokepoint blockages and rerouting near key waterways |
| Futures Curve | Term Structure | Identify physical scarcity through backwardation or oversupply through contango |
| Crack Spreads | Refining Signal | Gauge refinery margins and potential product shortages |
Put together, these inputs help you isolate the shock, trace the spillover, and read the market response.
Conclusion: What To Watch Next in Mineral Supply and Pricing
Mineral prices now move more on supply bottlenecks than on demand alone. That changes the job for analysts. You can't just watch price charts in isolation. You need to watch events and prices side by side.
The DXY dollar index is a useful filter here. Since commodities are priced in U.S. dollars, a stronger dollar can hide a supply-led move by putting pressure on demand. So if a mineral price shift looks muted at first glance, the dollar may be part of the story.
The next disruptions will most likely come from geopolitical chokepoints and refining bottlenecks. That's where things can tighten fast and ripple across related markets.
To track those spillovers in real time, watch Brent, WTI, natural gas, and gold together. Looking at them as a group helps isolate cross-market spillovers instead of treating each move like a one-off event. OilpriceAPI brings that data together in one timestamped feed, with both real-time and historical coverage.
Link events to prices, prices to spillovers, and spillovers to macro context.
FAQs
How do I tell a supply shock from weak demand?
Look at physical market constraints alongside price moves. A supply shock usually shows up when prices climb because of a clear bottleneck, like pipeline limits, refinery maintenance, or export controls, not because the economy is slowing down across the board.
It helps to compare price changes with inventory reports, storage signals, and production metrics. When inventories are getting tighter and physical constraints are stacking up, that points to actual scarcity rather than softer consumer demand.
Why do refining bottlenecks move prices so fast?
Refining bottlenecks can move prices fast because they put a direct physical limit on how much crude oil can be turned into gasoline, diesel, and jet fuel. When refinery capacity gets tight, or maintenance slows processing, supply often can't react in time to keep up with demand.
That gap can spark volatility because it weakens the usual connection between crude supply and the refined products people actually use. Analysts and developers can watch refinery capacity, storage signals, and refined product prices through OilpriceAPI.
Which markets should I watch first during a mineral disruption?
First, keep an eye on the main energy benchmarks and the physical infrastructure signals that can make price swings hit harder. Pay close attention to crude oil (WTI, Brent), natural gas (Henry Hub), and coal (Newcastle, CAPP, PRB), because they shape extraction and refining costs.
Use OilpriceAPI to follow real-time price moves and basis spreads that may hint at supply bottlenecks. It also helps to watch capacity notices, pipeline constraints, and storage signals. Those signs often show up before broader commodity price moves.