If I had to boil this guide down to one point, it’s this: use one service, one cache, and one normalized schema for Brent, WTI, natural gas, and gold.
That means I’d:
- call the right endpoint for the job: latest, historical, or metadata
- validate
price,code,unit, andcreated_atbefore using anything - keep math in raw numeric fields and use formatted values only for display
- store time in UTC, then show it in U.S. Eastern Time when needed
- poll on a set schedule, cache results, and mark quotes stale when they age out
- keep the API key out of scripts, dashboards, and source code
A few details matter more than they look:
- Units must match the commodity: crude is per barrel, gas is per MMBtu, and gold is per troy ounce
created_atis a feed timestamp, not proof that the market price changed- A 429 response needs backoff, not repeated retries
- Missing
unitor badcodeshould stop processing - For live views, 30–60 second polling is common; for risk or treasury work, 5–15 minutes often works
Here’s the short version: this guide shows how I’d choose endpoints, clean and map JSON, handle time and units for U.S. workflows, watch staleness and latency, and put the feed behind an internal service so every team reads the same numbers.
That’s the setup that keeps pricing, reporting, and risk checks aligned without turning the integration into a mess.
How To Get Commodity Price Data With Simple API
sbb-itb-a92d0a3
Choose the Right Endpoints for Brent, WTI, Natural Gas, and Gold
Every request to OilpriceAPI starts from the same base URL: https://api.oilpriceapi.com/v1/.
Pass your API key in the Authorization header like this: Authorization: Token YOUR_API_KEY.
From there, the path tells the API what kind of data you want. You’ll work with three main endpoint types:
- Latest for live pricing
- Historical for time-series work
- Metadata for symbol and unit checks
Pick the endpoint based on the job. If you need a live dashboard, use latest. If you’re running backtests or building reports, use historical. If you need to confirm symbols or units before parsing data, use metadata.
Latest vs. Historical Endpoints: When to Use Each
/prices/latest gives you the most recent price snapshot for each commodity.
If you want Brent, WTI, Natural Gas, and Gold in one request, add this query parameter:
by_code=WTI_USD,BRENT_CRUDE_USD,NATURAL_GAS_USD,GOLD_USD
That matters more than it might seem. If you leave out by_code, the API returns only a single default commodity, not the full set.
For backtesting and reporting, snapshots aren’t enough. That’s where /prices/historical comes in. Use start_date and end_date in YYYY-MM-DD format when you need a custom range for backtesting or scenario analysis.
If your use case is more routine, the fixed-window endpoints are simpler:
/prices/past_day/prices/past_week/prices/past_month
These work well for standard volatility reviews and monthly reporting because you don’t need to pass date parameters.
Fields and Units to Confirm Per Commodity
Before you write parsing logic, check the metadata endpoint for each instrument: GET /v1/commodities/{code}.
This small step can save a lot of pain. If your system assumes the wrong unit, you can end up with quiet pricing mistakes that slip through checks and show up later in reports or models.
Here are the standard units for the four commodities:
| Commodity | API Code | Unit | Currency |
|---|---|---|---|
| Brent Crude | BRENT_CRUDE_USD |
Per barrel | USD |
| WTI Crude | WTI_USD |
Per barrel | USD |
| Natural Gas | NATURAL_GAS_USD |
Per MMBtu | USD |
| Gold | GOLD_USD |
Per troy ounce | USD |
Endpoint Types by Finance Use Case: Comparison Table
Here’s the quick match between endpoint type and finance use case:
| Endpoint | Path | Key Parameters | Finance Use Case |
|---|---|---|---|
| Latest | /prices/latest |
by_code |
Intraday dashboards, live exposure checks |
| Historical (custom) | /prices/historical |
start_date, end_date, interval |
Backtesting, scenario analysis, volatility review |
| Historical (fixed) | /prices/past_month |
- | Monthly reporting, trend analysis |
| Metadata | /commodities/{code} |
code |
Unit verification, symbol mapping, integration setup |
The interval parameter on historical endpoints accepts values like 1h and 1d. Use daily data for reports and hourly data for intraday review.
Once you’ve picked the endpoint, the next step is to normalize the JSON fields and timestamps for U.S. systems.
Parse JSON Responses and Normalize the Data
Once you've confirmed your endpoint and units, the next step is pulling usable data out of the JSON response without letting bad values slip through. If parsing goes wrong, marks, exposure, and P&L can go wrong fast. Start by validating the response, then map the payload into one internal schema.
How to Read Key Fields Safely
Check the HTTP status first. Only parse the response body after a successful response. Accept payloads only when status is success, and treat all non-200 responses as errors.
For the price field, validate it before sending it into any calculation:
from decimal import Decimal, InvalidOperation

raw_price = data.get("price")
if raw_price in (None, ""):
    raise ValueError("Missing price")

try:
    price = Decimal(str(raw_price))
except InvalidOperation:
    raise ValueError(f"Non-numeric price: {raw_price}")
Use price for calculations and reject any alternate quote field.
Then run a commodity-specific range check. This helps catch unit mix-ups and bad feeds before they spread through your system.
Format Prices and Timestamps for U.S. Systems
Use formatted for UI and price for math.
If you need custom formatting, follow en-US rules: use a dollar sign, a period for decimals, and commas for thousands. In JavaScript, Intl.NumberFormat with { style: 'currency', currency: 'USD' } does that for you.
Store timestamps in UTC. For U.S. users, display them as MM/DD/YYYY h:mm AM/PM ET. Use region-based identifiers like America/New_York so daylight saving time is handled the right way.
created_at shows the last fetch time, not the last price change. If you want to detect a real market move, compare the new price with the previous one.
JSON Fields and Error-Handling Actions: Reference Table
| JSON Field | Role in Finance Workflow | Fallback if Missing or Invalid |
|---|---|---|
price |
Core value for mark-to-market, charts, and P&L | Reject update; hold last cached valid price; flag as stale |
formatted |
Ready-to-use USD string for UI display | Format price manually using en-US currency rules |
currency |
Determines FX conversion needs | Default to USD; log a warning for manual review |
created_at |
Freshness check and audit trail | Mark data as stale; use system arrival time as a secondary reference |
code |
Maps the quote to a specific instrument | Reject the payload if it cannot be mapped safely |
unit |
Defines the quantity basis | Halt calculations; do not guess a default |
Treat a missing or mismatched unit as a hard stop.
Once the data is normalized, set polling and freshness rules around it.
Set Polling, Caching, and Latency Checks
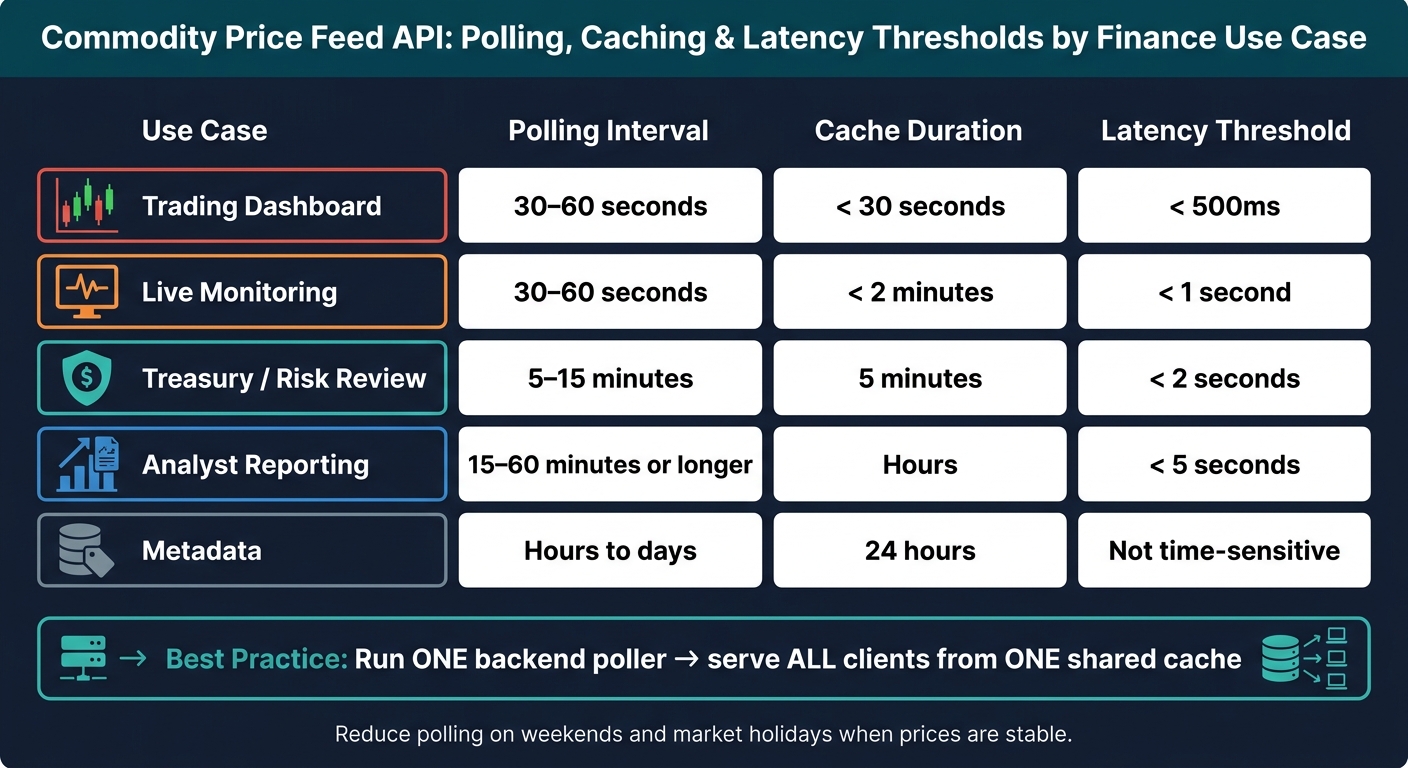
Commodity Price Feed API: Polling, Caching & Latency Thresholds by Finance Use Case
After normalization, you need to control three things: how often you refresh, how long cache entries live, and when data is too old to trust.
For live dashboards, a 30–60 second polling window usually makes sense. For treasury or risk tools, 5–15 minutes is often enough. A simple rule helps here: run one backend poller and let all clients read from the same cache. That cuts duplicate requests and helps protect your quota.
You should also watch X-RateLimit-Remaining and X-RateLimit-Reset. If you hit a 429, back off exponentially. That gives the provider time to recover and helps you avoid stale quotes or burned-through quota.
Freshness and latency should be tracked as two separate checks.
To measure freshness, compare created_at with the current UTC time. If that gap is outside your tolerance window, serve the last valid cached price, show it as stale in the UI, and wait before trying again. For latency, don’t rely on averages. Watch the 95th percentile latency instead. Averages can look fine while slow outliers quietly cause production headaches.
Use these settings to line up polling and cache behavior with each finance workflow:
| Use Case | Polling Interval | Cache Duration | Latency Threshold | Notes |
|---|---|---|---|---|
| Trading dashboard | 30–60 seconds | < 30 seconds | < 500ms | Prioritize freshness; alert quickly on stale data and serve the last known price with a stale flag |
| Live monitoring | 30–60 seconds | < 2 minutes | < 1 second | Fits most live dashboards |
| Treasury / risk review | 5–15 minutes | 5 minutes | < 2 seconds | Confirm quote is within your freshness window using created_at |
| Analyst reporting | 15–60 minutes or longer | Hours | < 5 seconds | Use historical endpoints; reproducibility matters more than sub-minute freshness |
| Metadata | Hours to days | 24 hours | Not time-sensitive | Instrument definitions and symbol mappings rarely change |
One more practical tweak: reduce polling on weekends and market holidays. If prices barely move, there’s no reason to keep hammering the API.
With polling and freshness under control, the last step is wiring the feed into your apps and analyst tools.
Connect the Feed to Finance Apps and Analyst Tools
First Setup Steps for a Production-Ready Integration
Once polling and freshness checks are set, route every consumer through one internal service.
Do not put the API key in source code, analyst scripts, or BI tools. Store it in a production secrets manager, and make startup fail if the key is missing. That one choice can save you a lot of pain later.
Build a single service that fetches, parses, and serves normalized data. Use the batch endpoint GET /v1/prices/all?codes=WTI_USD,BRENT_CRUDE_USD,NATURAL_GAS_USD,GOLD_USD to refresh all four commodities in one request per polling cycle. Then expose one internal feed for dashboards, spreadsheets, and notebooks. Keep every external API call inside that service.
That way, you avoid the usual mess: keys scattered across tools, mismatched parsing logic, and five teams pulling the same data five different ways.
Validation Checks Before You Go Live
Run these checks in a staging environment before promoting to production:
- Schema and parsing: Confirm numeric parsing, UTC timestamps, ET display formatting, and unit mapping for each commodity.
- Stale-data detection: Block outbound calls for a short time and verify that your system marks data as stale, shows a warning in the UI, and falls back to the last cached price while flagging the quote as stale.
- Error handling: Force 429, 401, 500, and 404 responses and verify retries, backoff, logging, and HTTP-status checks before JSON parsing.
- Mark-to-market accuracy: Run a sample position, such as long 10,000 barrels of WTI, through your pricing pipeline and verify that the P&L matches a hand-calculated result using the same benchmark price.
Log each call’s endpoint, status, duration, and X-Request-Id.
If staging passes, keep production simple: one service, one cache, one source of truth.
Conclusion: The Minimum Setup That Matters
A reliable commodity price feed comes down to six things working together: the correct endpoints for Brent, WTI, natural gas, and gold; secure key storage outside of code and scripts; safe JSON parsing that maps provider fields into normalized USD prices, standard units, and ISO 8601 timestamps; central polling and caching that serves all consumers from one source; latency and freshness monitoring with clear thresholds; and a reusable service layer that keeps dashboards, spreadsheets, and analyst tools away from the raw API.
Get those six elements right, and the feed becomes a stable base for risk, reporting, and analysis.
FAQs
How do I know when a quote is too stale to use?
Compare the current time with the timestamp in the API response. Use created_at or the commodity’s last_updated value to judge freshness.
Update timing can vary by commodity and source, so don’t treat a delayed timestamp as stale right away. First, check the publication schedule in the response.
For real-time WebSocket streams, track the time since the last message. If nothing arrives within 60 seconds, the stream may be stale.
What should my app do after a 429 rate-limit response?
A 429 Too Many Requests response means your app went over the sustained limit of 60 requests in a rolling 60-second window.
Check the Retry-After header and wait that long before you retry the request. If that header is missing, wait 60 seconds.
It also helps to:
- use exponential backoff
- cache responses so you make fewer unnecessary calls
- review the X-RateLimit headers to confirm your current limit
Why use an internal service instead of calling the API directly?
An internal service or proxy puts all requests in one place. That makes it much easier to add caching, custom retry rules, standard error handling, and data monitoring. The result is better performance, more reliable requests, and more consistent data quality.
It also helps keep authentication safer by keeping sensitive API keys out of public code. And as your data needs grow, this setup makes it easier for your application to scale without turning into a mess.