If you want this setup to work, I’d check five things first: the workbook goal, API key storage, Brent/WTI symbols, refresh timing, and export blocks. That’s the core of the article.
I’d keep the process simple: set the report purpose first, store the API key outside worksheet cells, use BRENT_CRUDE_USD and WTI_USD, match refreshes to plan limits, and stop exports when data is stale, missing, or incomplete. The article also points out a quota gap: about 10,000 requests/month on Developer plans vs. about 100,000/month on Professional plans, with example refresh pacing of hourly vs. every 15 minutes.
If I were setting this up, my short checklist would be:
- Pick the workbook job first: intraday, end-of-day, or history
- Use U.S. formats from the start: $, U.S. dates, comma thousands, period decimals, and USD/barrel
- Keep the API key out of cells and store it through the add-in
- Test with one live formula before building the report
- Use the right symbols:
BRENT_CRUDE_USDandWTI_USD - Separate live prices from history so each sheet can refresh on its own schedule
- Build three report tabs: Brent, WTI, and Brent-WTI Spread
- Keep an Error Log with status codes, request IDs, and timestamps
- Block XLSX, CSV, and PDF exports if data is stale,
#NO_DATAappears, orMISSING CODESshows up - Run one final validation pass for price, currency, unit, timestamp, and status
A fast way to think about it: this isn’t just an Excel formula setup. It’s a control checklist for data access, formatting, quota use, logging, and safe exports.
Learn Exactly How to Get Crude Oil, Natural Gas & Other Commodities Prices in Excel
sbb-itb-a92d0a3
Prepare Excel and Secure the OilpriceAPI Connection
With the formatting rules set, the next step is connecting Excel to the data source.
Check Excel add-in readiness and connection settings
Start with a verified Excel build that supports authentication, recalculation, and diagnostics that do not expose secrets. Then make sure the OilPrice add-in is visible and loaded in the Excel ribbon.
After that, review your Excel Trust Center settings so Excel can allow HTTPS requests and external data connections. The add-in needs those permissions to work and must be able to deal with blocked requests and CORS errors.
Once Excel can reach the add-in, move on to storing the key.
Store the API key without exposing it in the workbook
Never place the API key in a worksheet cell. Enter it through the add-in task pane so it stays outside the workbook.
The add-in stores the key in OfficeRuntime.storage, and diagnostics and logs do not expose the key or formula inputs. A hidden sheet should only be used as a temporary fallback. If you do use one, remove the key before sharing or exporting the file.
After the key is stored, check access with a live formula.
Test authentication with a live price request
Before you build the workbook, test the connection with a single formula. Enter =OILPRICE.PRICE("BRENT_CRUDE_USD") in an empty cell.
If authentication is working, Excel returns a numeric result. You can also run =OILPRICE.STATUS("BRENT_CRUDE_USD") to check freshness status if that matters for your workflow.
That working connection is the starting point for Brent and WTI formulas, refresh rules, and exports.
Configure Brent and WTI Data Inputs
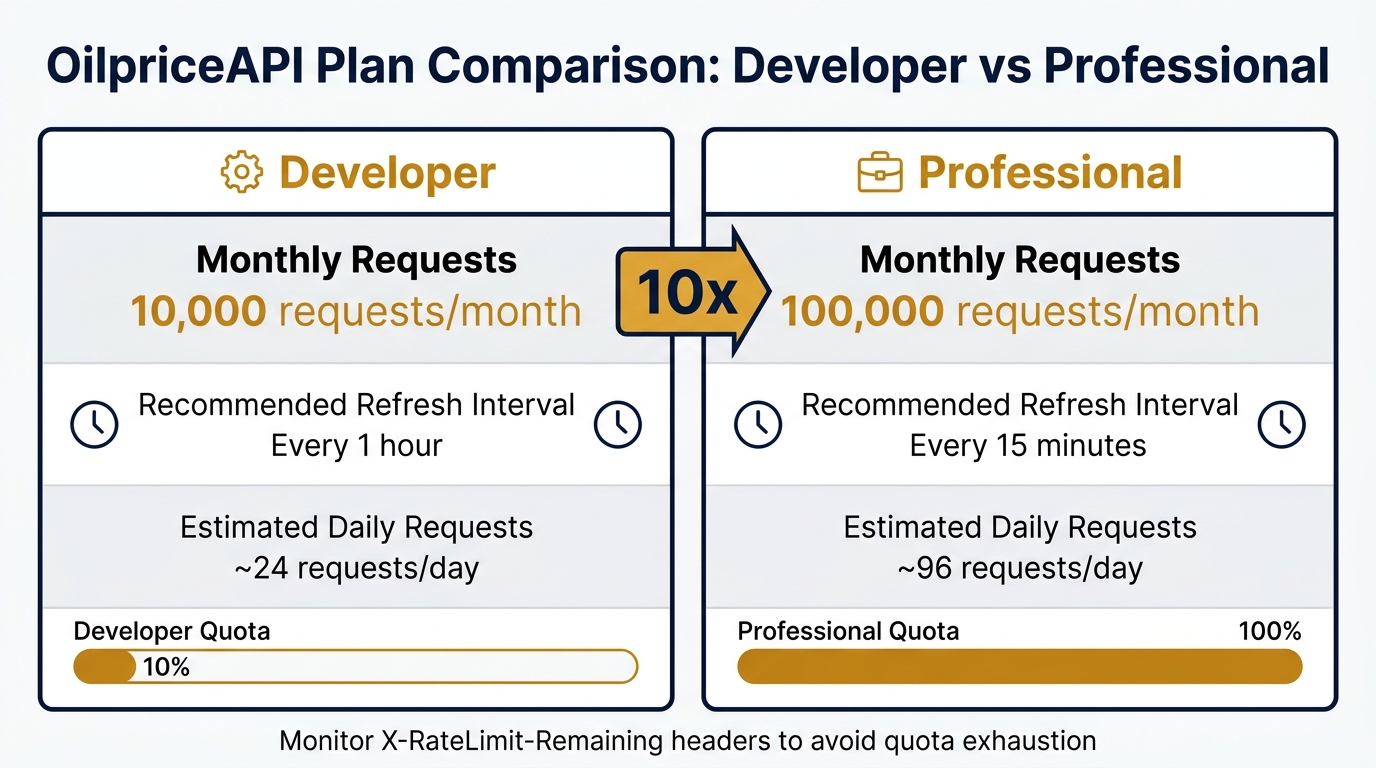
OilpriceAPI Excel Add-In: Developer vs Professional Plan Comparison
Once authentication is working, the next step is to set up the workbook inputs that control Brent and WTI reporting.
Select the correct Brent and WTI symbols
The official Brent and WTI symbols are BRENT_CRUDE_USD and WTI_USD. Put each symbol in a Settings sheet once, then point the rest of the workbook to those cells. For example, if A2 contains BRENT_CRUDE_USD, use:
=OILPRICE.PRICE(A2)
That small setup choice saves time later. If a symbol ever changes, you update it in one place instead of hunting through formulas across the workbook.
Use =OILPRICE.INFO("BRENT_CRUDE_USD") when you want metadata. PRICE returns a plain number, which makes it better for spreadsheet math. INFO returns the price, currency, unit, source, and timestamp. If you want to see the full symbol list tied to your API key, run:
=OILPRICE.CODES()
Set refresh intervals that match the reporting use case
Your refresh schedule should match the job the workbook is doing. A file used for scheduled reporting doesn't need the same pace as a live dashboard.
| Plan | Monthly Requests | Recommended Refresh | Est. Daily Requests |
|---|---|---|---|
| Developer | 10,000 | Every hour | ~24 |
| Professional | 100,000 | Every 15 minutes | ~96 |
For scheduled reports, refresh on file open. For live monitoring, use a scheduled refresh set to the interval that fits your plan.
If you need both benchmarks at the same time, pull them in one request with:
=OILPRICE.GET("/v1/prices/latest", "by_code=WTI_USD,BRENT_CRUDE_USD")
That keeps things tidy and helps control request usage. Also watch the X-RateLimit-Remaining and X-RateLimit-Limit response headers. If your quota starts getting tight, increase the refresh interval.
Separate live and historical data pulls
Use =OILPRICE.PRICE() for the latest value and =OILPRICE.GET() with a historical endpoint for time-series data. Keep live monitoring and historical analysis on separate worksheets so each one can follow its own refresh pattern.
For daily history, add the interval=1d parameter. It also helps to label each historical range with both the interval and the date range. That way, when you come back later, you won't have to guess what the data set is showing.
These inputs now feed the worksheet layout, logging, and export rules in the next step.
Build the Worksheet, Logging, and Export Rules
Once the inputs are set, the next step is to turn them into a clean workbook setup with reporting sheets, an audit trail, and export checks.
Design sheets for Brent, WTI, and spread reporting
Set up three separate sheets:
- Brent
- WTI
- Brent-WTI Spread
Keep the layout the same on all three. Use these fields:
- Commodity
- Latest Price
- 24h Change
- % Change
- Last Updated
Show the source and timestamp next to the price so anyone reading the sheet can see where the number came from and when it was pulled. Add conditional formatting for gains and losses so up and down moves stand out right away.
On the Brent-WTI Spread sheet, calculate the spread from the live price cells on the Brent and WTI tabs. Don’t hardcode values. Pull them from those two commodity sheets so the spread updates with the live data. If either price is unavailable, the add-in returns #NO_DATA. In that case, block the spread calculation.
After the report layout is in place, move to the control layer: logging and stale-data checks.
Add an error log and stale-data indicators
Create a dedicated Error Log sheet. Use columns for timestamp, request ID, symbol, HTTP status code, and error message. This gives you a plain record of what failed and when.
Log these common failures:
| Status Code | What It Means | Action |
|---|---|---|
| 400 | Invalid commodity code | Validate the code against /v1/commodities. |
| 401 | Missing or invalid API key | Check the key in OfficeRuntime.storage. |
| 404 | Endpoint format error | Pass the commodity code as a query parameter. |
| 429 | Rate limited or quota exceeded | Read Retry-After and slow refreshes. |
| 500 | Server-side failure | Retry after checking service status. |
Use =OILPRICE.STATUS("CODE") on each commodity sheet to show data status right in the report. That way, a user doesn’t need to dig through logs to see if the feed is healthy.
If a refresh fails, make the cached price easy to spot. You can do that with conditional formatting or a plain stale label. Either works, as long as nobody mistakes old data for current data. For multi-code pulls, treat any visible MISSING CODES row as a hard stop before export.
Define export rules for XLSX, CSV, and PDF outputs
Export only the named ranges for Brent, WTI, and Spread. This keeps the Error Log and any diagnostic sheets out of the files you share.
Use the API time for export stamps, not the system clock. That matters because the workbook clock and the data clock aren’t always the same thing.
Block export if any of these checks fail:
- Data is stale
- Any cell shows
#NO_DATA - A multi-code pull shows
MISSING CODES
Those gates should run before the final Brent-WTI validation pass.
Final Validation and Setup Summary
Run a full Brent and WTI validation pass
With the Brent, WTI, Brent-WTI Spread, and Error Log sheets already in place, do one last validation pass before release. The goal is simple: make sure the add-in installs correctly, stores the key safely, reaches the live API, and recalculates the workbook without issues.
Use this table as the final checklist:
| Validation Target | Expected Result | Formula |
|---|---|---|
| Brent Price | Numeric value formatted as $xx.xx | =OILPRICE.PRICE("BRENT_CRUDE_USD") |
| WTI Price | Numeric value formatted as $xx.xx | =OILPRICE.PRICE("WTI_USD") |
| Currency | USD |
=OILPRICE.INFO("BRENT_CRUDE_USD") |
| Unit | barrel |
=OILPRICE.UNIT("BRENT_CRUDE_USD") |
| Data Freshness | fresh or stale |
=OILPRICE.STATUS("WTI_USD") |
| Timestamp | ISO 8601 source timestamp displayed in U.S. date/time format | =OILPRICE.INFO("BRENT_CRUDE_USD") |
Make sure the source timestamp appears next to each price. Also check that Excel converts the ISO 8601 value into a standard U.S. date/time display before the workbook goes live. Check quota headroom before release too.
It’s also worth testing the ugly case on purpose. Use an invalid API key and confirm the workbook returns #NO_DATA - not zero - for unauthorized or rate-limited responses.
Key points to carry into production use
Carry these checks into production:
- No stale data or
#NO_DATAcells - treat either one as a hard stop before export. - Error Log is clear - no unresolved
MISSING CODESrows. - Every export includes the source timestamp, USD, and barrel labels.
- Reporting tabs are protected - live formula cells are locked against accidental edits.
FAQs
How do I know if my workbook needs live data or historical data?
Use historical data when your workbook needs trend analysis, backtesting, or past market context, not just a current market snapshot.
Before you use a historical workflow, make sure the dataset actually matches the job. Don’t assume each row is an official settlement unless the source says so. Check the date, price, and source fields first.
For contract-level data, such as OHLC or settlement-style fields, use the futures-specific pages instead of general historical endpoints.
What should I do if Excel shows #NO_DATA or stale prices?
Use the add-in’s refresh feature to recalculate the workbook. If prices still seem out of date, run a manual refresh from the add-in pane to force formulas to pull the latest production data.
Also check that your API key is stored correctly in the task pane and that your symbol inputs are valid. The add-in may return worksheet error strings for network failures, quota limits, or invalid data states.
How can I avoid hitting my monthly API request limit?
Cache price data in your cells instead of firing the same API call over and over, and set your workbook refresh rate to match your plan, like hourly or every six hours.
It also helps to use bulk fetching so you can pull multiple commodities in a single request. On top of that, watch your usage through the X-RateLimit headers, and move to a higher plan if you need more volume.