Energy in charts · 01 / Diesel and crude
Why diesel rose faster than crude: the spread in one chart
By OilPriceAPI · · Dated analysis
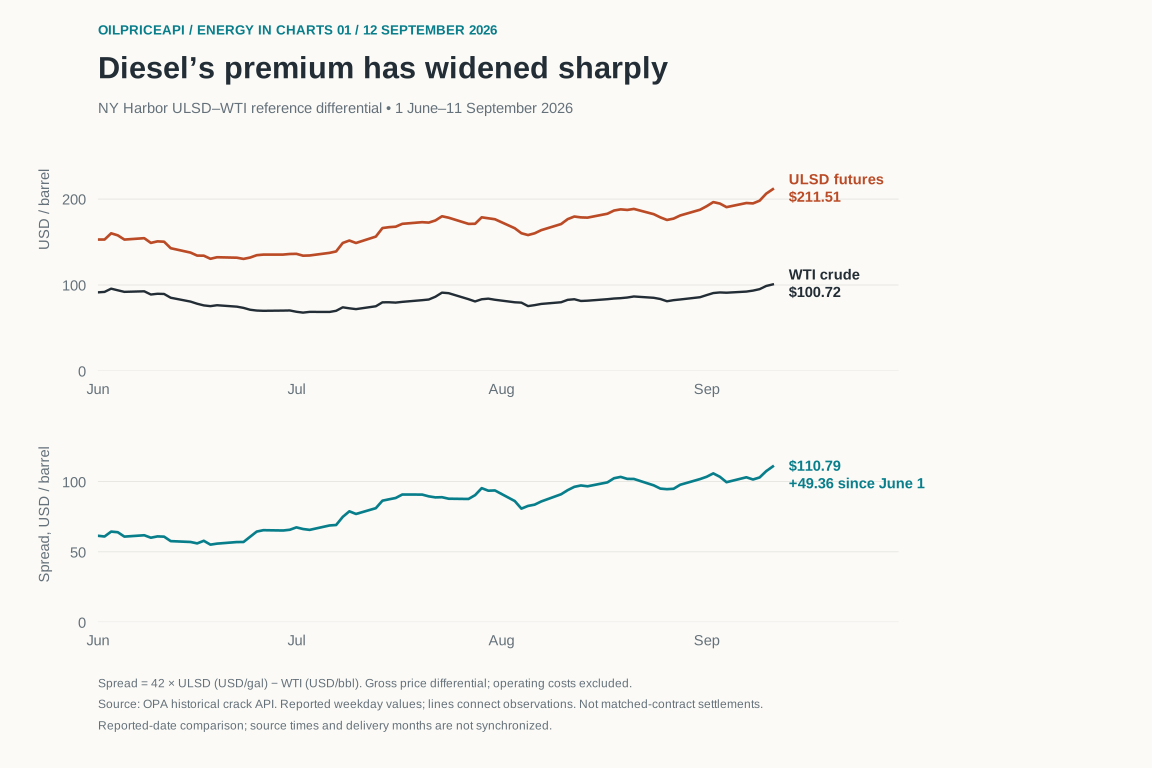
The diesel benchmark increased much faster than crude. In these OPA reference series, the differential widened by $49.36 per barrel from June 1 to September 11.

The gap tells a different story from crude alone
Over this window, the ULSD reference increased from $152.85 to $211.51 per barrel, a $58.66 rise. WTI increased from $91.42 to $100.72, a $9.30 rise. The difference moved from $61.43 to $110.79 per barrel.
That gap is a simple product crack: a refined-product price minus a crude reference price. It helps explain why tracking crude alone can miss changes in a diesel-related input. It does not establish what any particular refinery earned or what a fleet paid at the pump.
Put both inputs in the same units
The HEATING_OIL_USD code names the NY Harbor ULSD futures reference and is quoted in US dollars per gallon. Multiply by 42 US gallons per barrel before subtracting WTI_USD. The downloadable snapshot retains the API’s converted product and crude components so the arithmetic can be checked.
Simple crack = 42 × ULSD (USD/gallon) − WTI (USD/barrel). This differs from a 3-2-1 crack, which combines two barrels of gasoline and one barrel of distillate against three barrels of crude. A composite can therefore move differently from the diesel component.
What the chart can—and cannot—tell you
The two series are joined by reported date, not verified synchronized source timestamps and delivery months. Treat the result as an OPA reference differential, not a matched-contract settlement spread or a European physical diesel assessment. Refining costs, yields, transport and taxes are not deducted.
A rising spread is not itself a volatility measure. To investigate variability, examine changes over consistently aligned trading sessions and account for contract rolls and missing observations. A later pullback would change the next chart; this analysis makes no forecast.
Reproduce the analysis
Download the dated inputs and Python example, which writes a calculated CSV for your charting tool. The snapshot is fixed so another reader can check the same numbers; a later API request may contain revisions. No API key is needed for these downloads.
python3 reproduce.py crack.csvTo request updated data, use the endpoint below with your API key in the Authorization header. History and analytics access depend on your account; check the response status and coverage before using any values.
curl --fail-with-body \
  'https://api.oilpriceapi.com/v1/spreads/crack/historical?type=diesel&crude=WTI_USD&start_date=2026-06-01&end_date=2026-09-11' \
  -H "Authorization: Token $OILPRICEAPI_KEY"
Source: OilPriceAPI historical crack API, captured September 12, 2026. The API returned 89 dated observations; the chart uses all 75 weekday observations within the stated window. Each reported difference agrees with product minus crude to within one cent. Lines connect observations. Daily component selection can differ between summaries and raw observations; values are not labeled as exchange closes.
Recreate this spread in your own report
Use the frozen data below to reproduce the analysis, then check the API’s history access and benchmark fit for your recurring report.