Energy in charts · 02 / Fuel costs
What the diesel price jump adds to a fuel surcharge
By OilPriceAPI · · Dated analysis
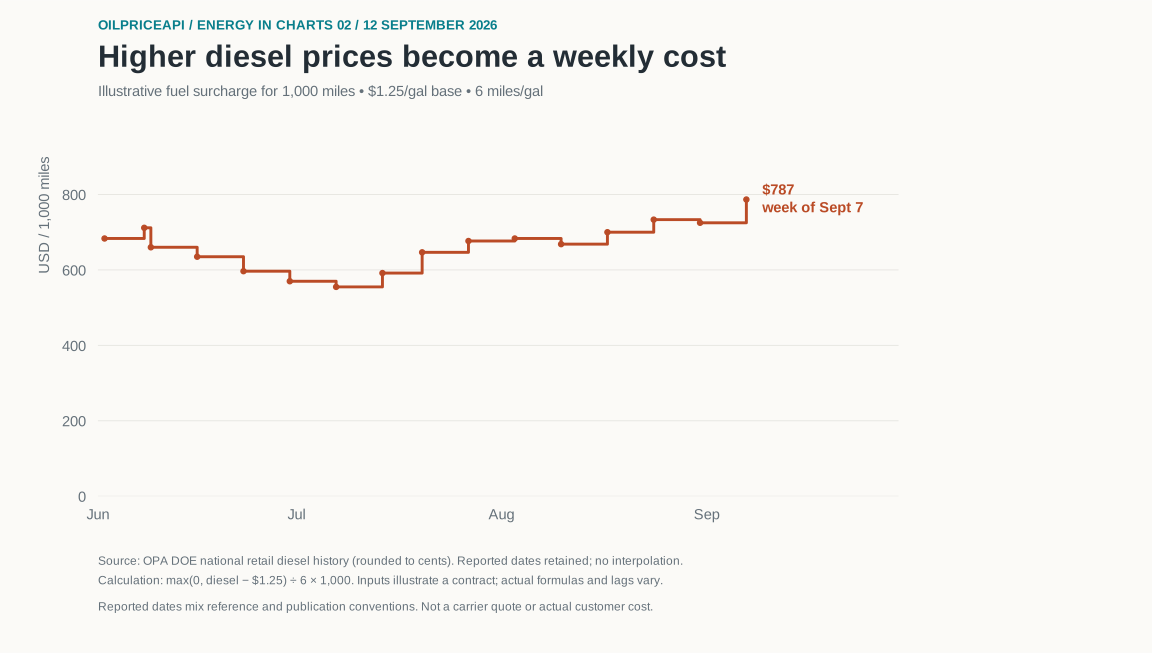
At 6 miles per gallon, a $0.37 increase in diesel adds $61.67 per 1,000 miles. That is the change implied by OPA’s cent-rounded August 31 and September 7 observations.

Turn the price move into a working number
OPA’s DOE national retail diesel history reports $5.60 per gallon for August 31 and $5.97 for September 7. With the same mileage and efficiency, the increase passes directly into this illustrative surcharge formula.
Surcharge = max(0, diesel price − base price) ÷ miles per gallon × miles. At $5.97 diesel, a $1.25 base and 6 mpg, the result is $786.67 for 1,000 miles. The previous observation produces $725.00.
Precision and dates matter when money is involved
EIA’s September 9 publication gives the exact September 7 reference value as $5.967, versus $5.599 for August 31. Those original values produce a $61.33 increase per 1,000 miles and a $786.17 surcharge under the same assumptions. OPA’s daily history endpoint rounds these values to cents; do not silently mix the two levels of precision.
A reference date is not necessarily the date a value became available. This snapshot preserves the API’s reported dates, which mix reference and publication conventions. A billing workflow must apply the contract’s exact benchmark, precision, publication lag and effective date.
Use your contract’s inputs
The $1.25 base, 6 mpg and zero floor are explicit teaching assumptions. Carrier schedules can use different base prices, regional indexes, brackets, lags or percentage-of-linehaul formulas. A chart cannot substitute for those terms.
The recurring job is to fetch the right published benchmark, apply the agreed formula, and retain the inputs behind each quote. A missing or malformed price should stop the calculation with a clear error, rather than silently contribute zero.
Exact published values: EIA Gasoline and Diesel Fuel Update, September 9, 2026 release.
Reproduce the analysis
Download the dated inputs and Python example, which writes a calculated CSV for your charting tool. The snapshot is fixed so another reader can check the same numbers; a later API request may contain revisions. No API key is needed for these downloads.
python3 reproduce.py diesel.csvTo request updated data, use the endpoint below with your API key in the Authorization header. History and analytics access depend on your account; check the response status and coverage before using any values.
curl --fail-with-body \
  'https://api.oilpriceapi.com/v1/prices/past_year?interval=1d&by_code=DIESEL_RETAIL_USD' \
  -H "Authorization: Token $OILPRICEAPI_KEY"
Source: OilPriceAPI DIESEL_RETAIL_USD history, captured September 12, 2026, rounded to cents. The chart retains all 16 returned observations from June 2 through September 7; steps illustrate reported values between observations, not verified carrier effective dates. The annual response withholds 14 unreliable historical dates before this chart window; it does not certify interval completeness. No missing values are filled.
Make your next fuel calculation reproducible
Try your own mileage, base and efficiency in the calculator. For a recurring spreadsheet or transport system, inspect the API example and confirm the source fits your contract.