Energy in charts · 03 / European gas
European gas prices: the climb into September, charted
By OilPriceAPI · · Dated analysis
OPA’s Dutch TTF reference rose from €47.83 to €80.77 per MWh between June 1 and September 11: an increase of approximately 69%.

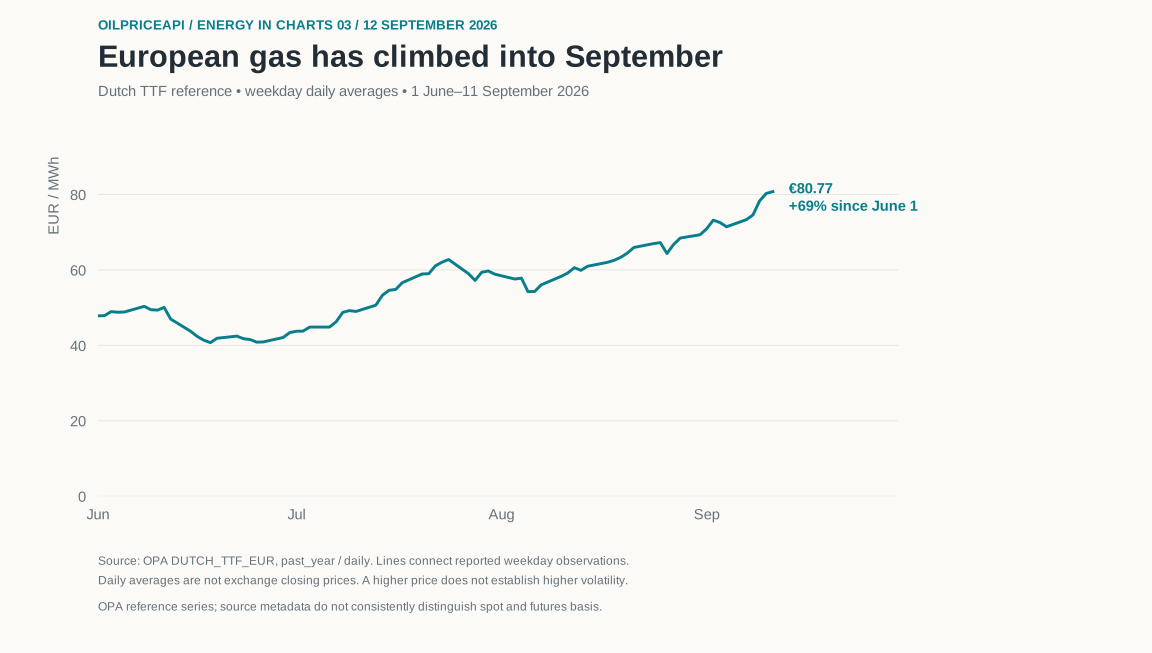
A summer window with a sharp September finish
The series declined during June before rising through July and August. By September 11 its daily aggregate was €80.77 per MWh. Keeping the chart in its native units makes the price move visible without introducing an exchange-rate effect.
The chart describes this OPA reference series. It does not establish a household energy tariff, an exchange settlement or the causes of the move. Price level and volatility are separate questions; a higher endpoint does not by itself establish greater variability.
Identify the series before comparing it
This snapshot uses DUTCH_TTF_EUR. OPA’s source metadata do not consistently distinguish its spot versus futures basis, so this article deliberately identifies it as a reference series. It should not be used as a verified spot or matched-delivery futures comparison.
OPA separately identifies NATURAL_GAS_TTF_SPOT_EUR as a physical spot series. It has a different history and definition. Do not silently substitute one series for the other or promise a multi-year seasonal band without checking actual coverage.
Comparing Europe with US gas takes two conversions
TTF is expressed here in EUR/MWh; a US gas reference may be quoted in USD/MMBtu. Convert both currency and energy units before comparison: TTF USD/MMBtu = TTF EUR/MWh × USD per EUR ÷ 3.412141633.
Use an exchange rate from the corresponding observation date and align benchmark definitions and delivery periods. Even then, a Europe–US price difference excludes liquefaction, freight and other costs, so it is not an LNG profit calculation.
Reproduce the analysis
Download the dated inputs and Python example, which writes a calculated CSV for your charting tool. The snapshot is fixed so another reader can check the same numbers; a later API request may contain revisions. No API key is needed for these downloads.
python3 reproduce.py ttf.csvTo request updated data, use the endpoint below with your API key in the Authorization header. History and analytics access depend on your account; check the response status and coverage before using any values.
curl --fail-with-body \
  'https://api.oilpriceapi.com/v1/prices/past_year?interval=1d&by_code=DUTCH_TTF_EUR' \
  -H "Authorization: Token $OILPRICEAPI_KEY"
Source: OilPriceAPI DUTCH_TTF_EUR daily aggregates, captured September 12, 2026. All 75 reported weekday observations from June 1 through September 11 are plotted; lines connect observations. The annual response contains 324 buckets and explicitly does not evaluate daily interval completeness. Aggregates are based on reported date buckets, not verified exchange closing times.
Build a repeatable European gas report
Start with the dated snapshot and reproducible example. Before automating a comparison, confirm the benchmark, history, units and delivery-period requirements of your own report.